Process
1. Data Collection
Collection of data from 60 condos, recording them in Google Sheets.
2. Data Analysis
Taking the data we've collected and making sense of it. Finding creative ways to analyse it and draw conclusions through cross-analysis across different data sets.
3. Artefact Design
Our artefact is an imaginary real estate development company, presented through a website, e-brochure, video and quiz.
1. Data Collection
We set out to collect data from condos across 6 districts, 10 condos each. This gave us a total of 60 condos to collect from.
We separated our data points into two categories, primary and secondary.
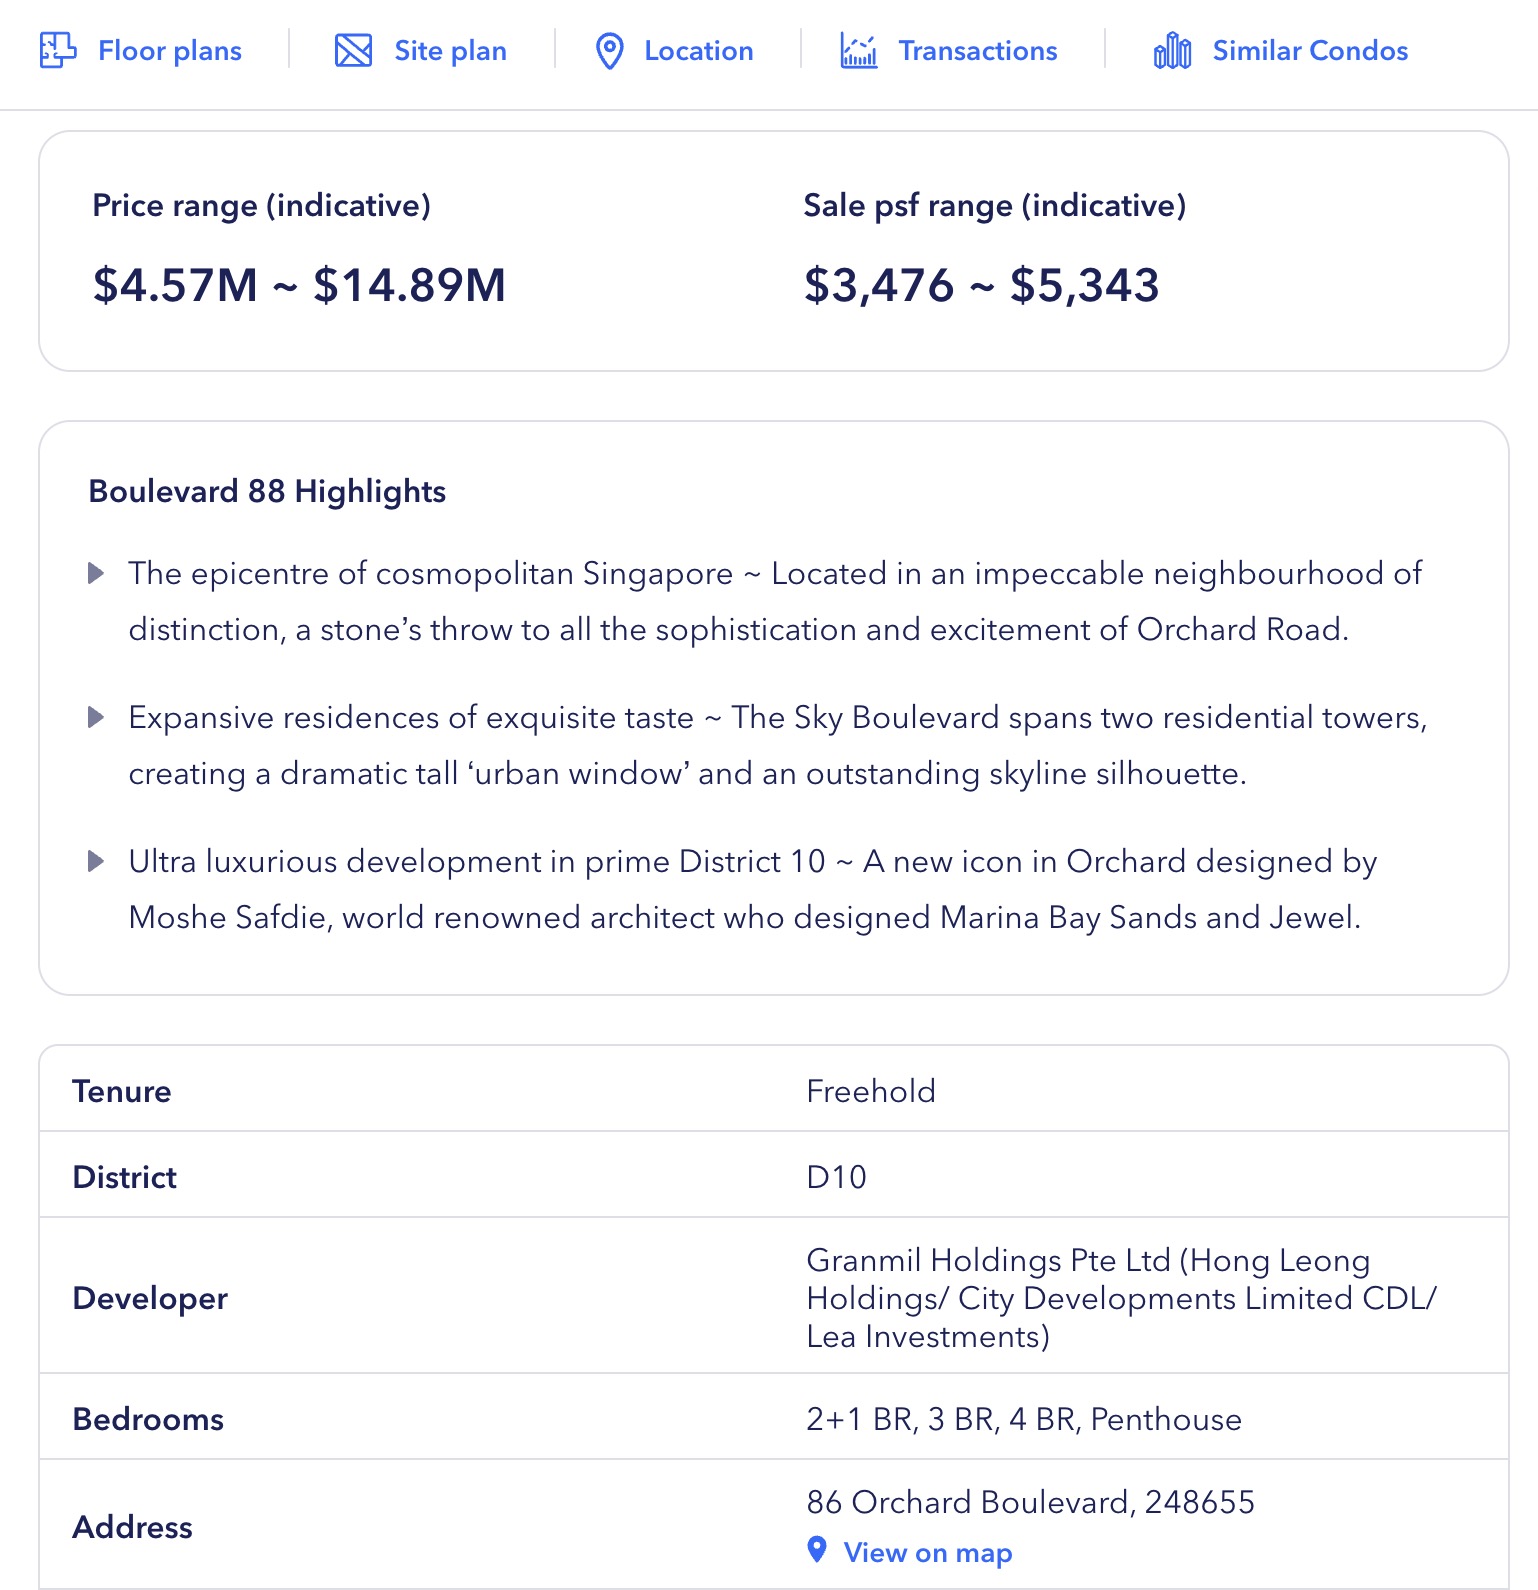
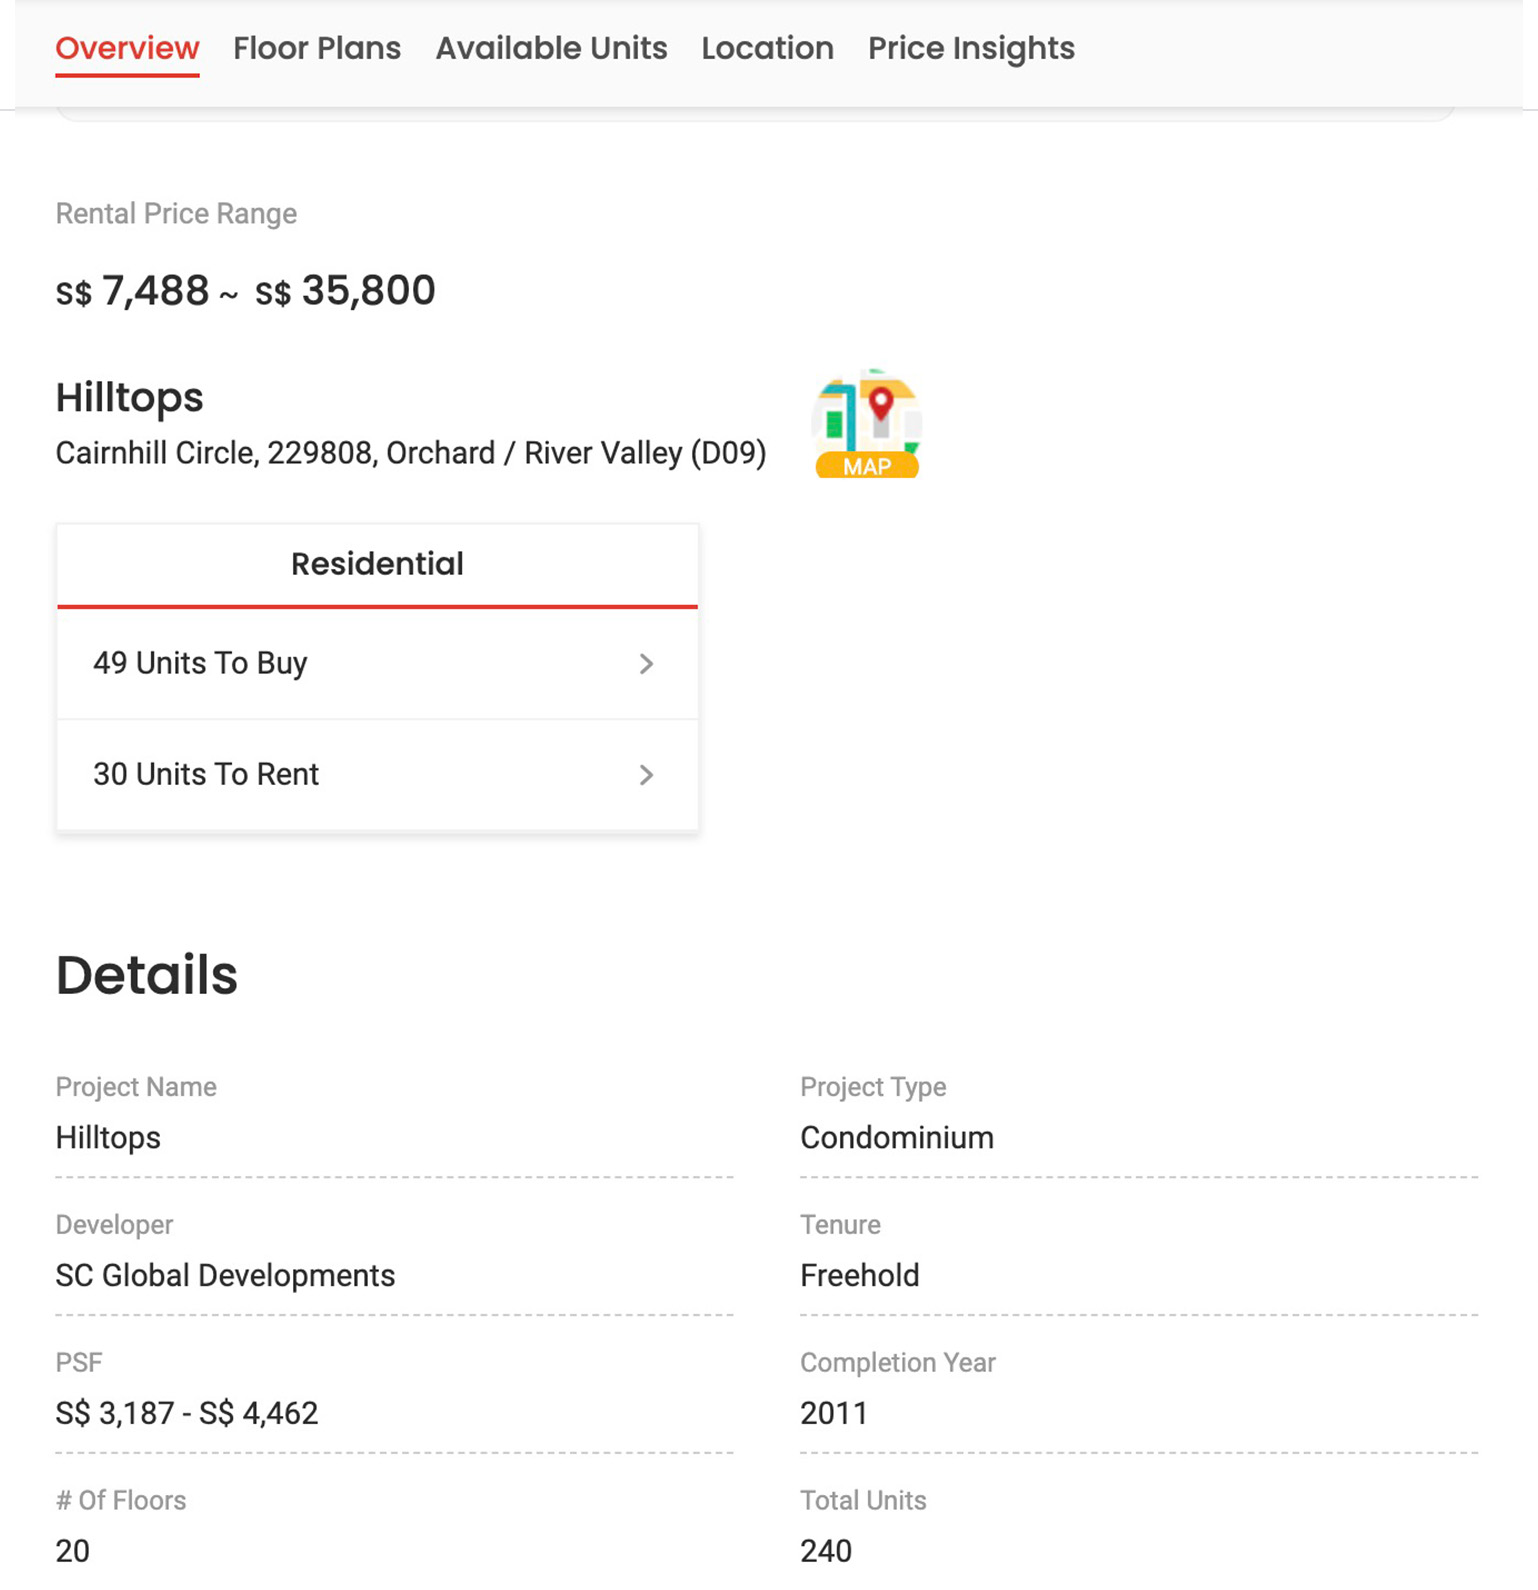
Primary data consists of general information of the condos.
- Developer
- Year of Completion
- No. of Floors and Units
- Land Area
- Amenities
- Size of Pool
- Prices (PSQ, Rent/Sale Range, Rent/Sale Price of 2BR Units)
Secondary data aid us in understanding residents’ lifestyle choices, the image each condominium wants to portray, the actual desires and expectations of condo residents.
- Marketing Copywriting
- Website Design Notes
- Fun Facts
- Condo Aesthetic Approach
- Reviews
Data Sources
We found that most of our data was available on property sites such as Property Guru or 99.co. We could find most of the general information such as rent/sale range and prices, amenities etc.
For secondary data like website design, copywriting, we turned to the websites that we could find. This, as we found, was more easily available in newer condos that still have their websites up and running. If not, we search for articles on the condominium from websites like Stacked Homes.
Data Recording
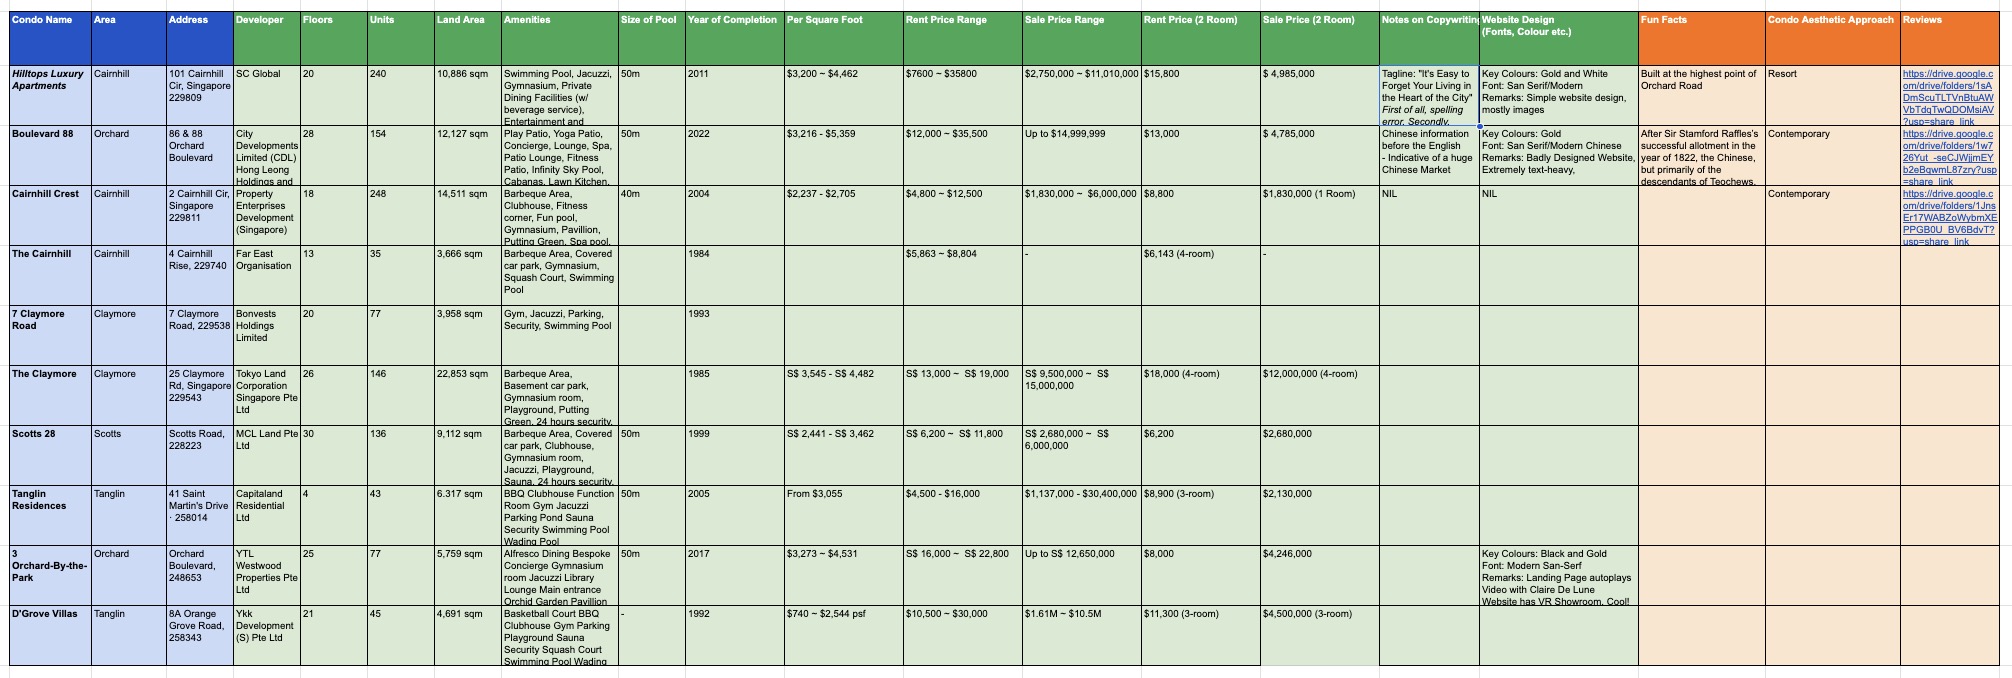
We then set up an excel sheet that documented all the data so that we could sort and analyse them later.
The google sheet was split into 6 districts, for ease of tracking data.
Very loooong list of data...we had a total of 1200 cells to fill.
2. Data Analysis
After the data collection, it was time to make sense of it before we could start on our artefact. We used 3 main methods to sort the data.
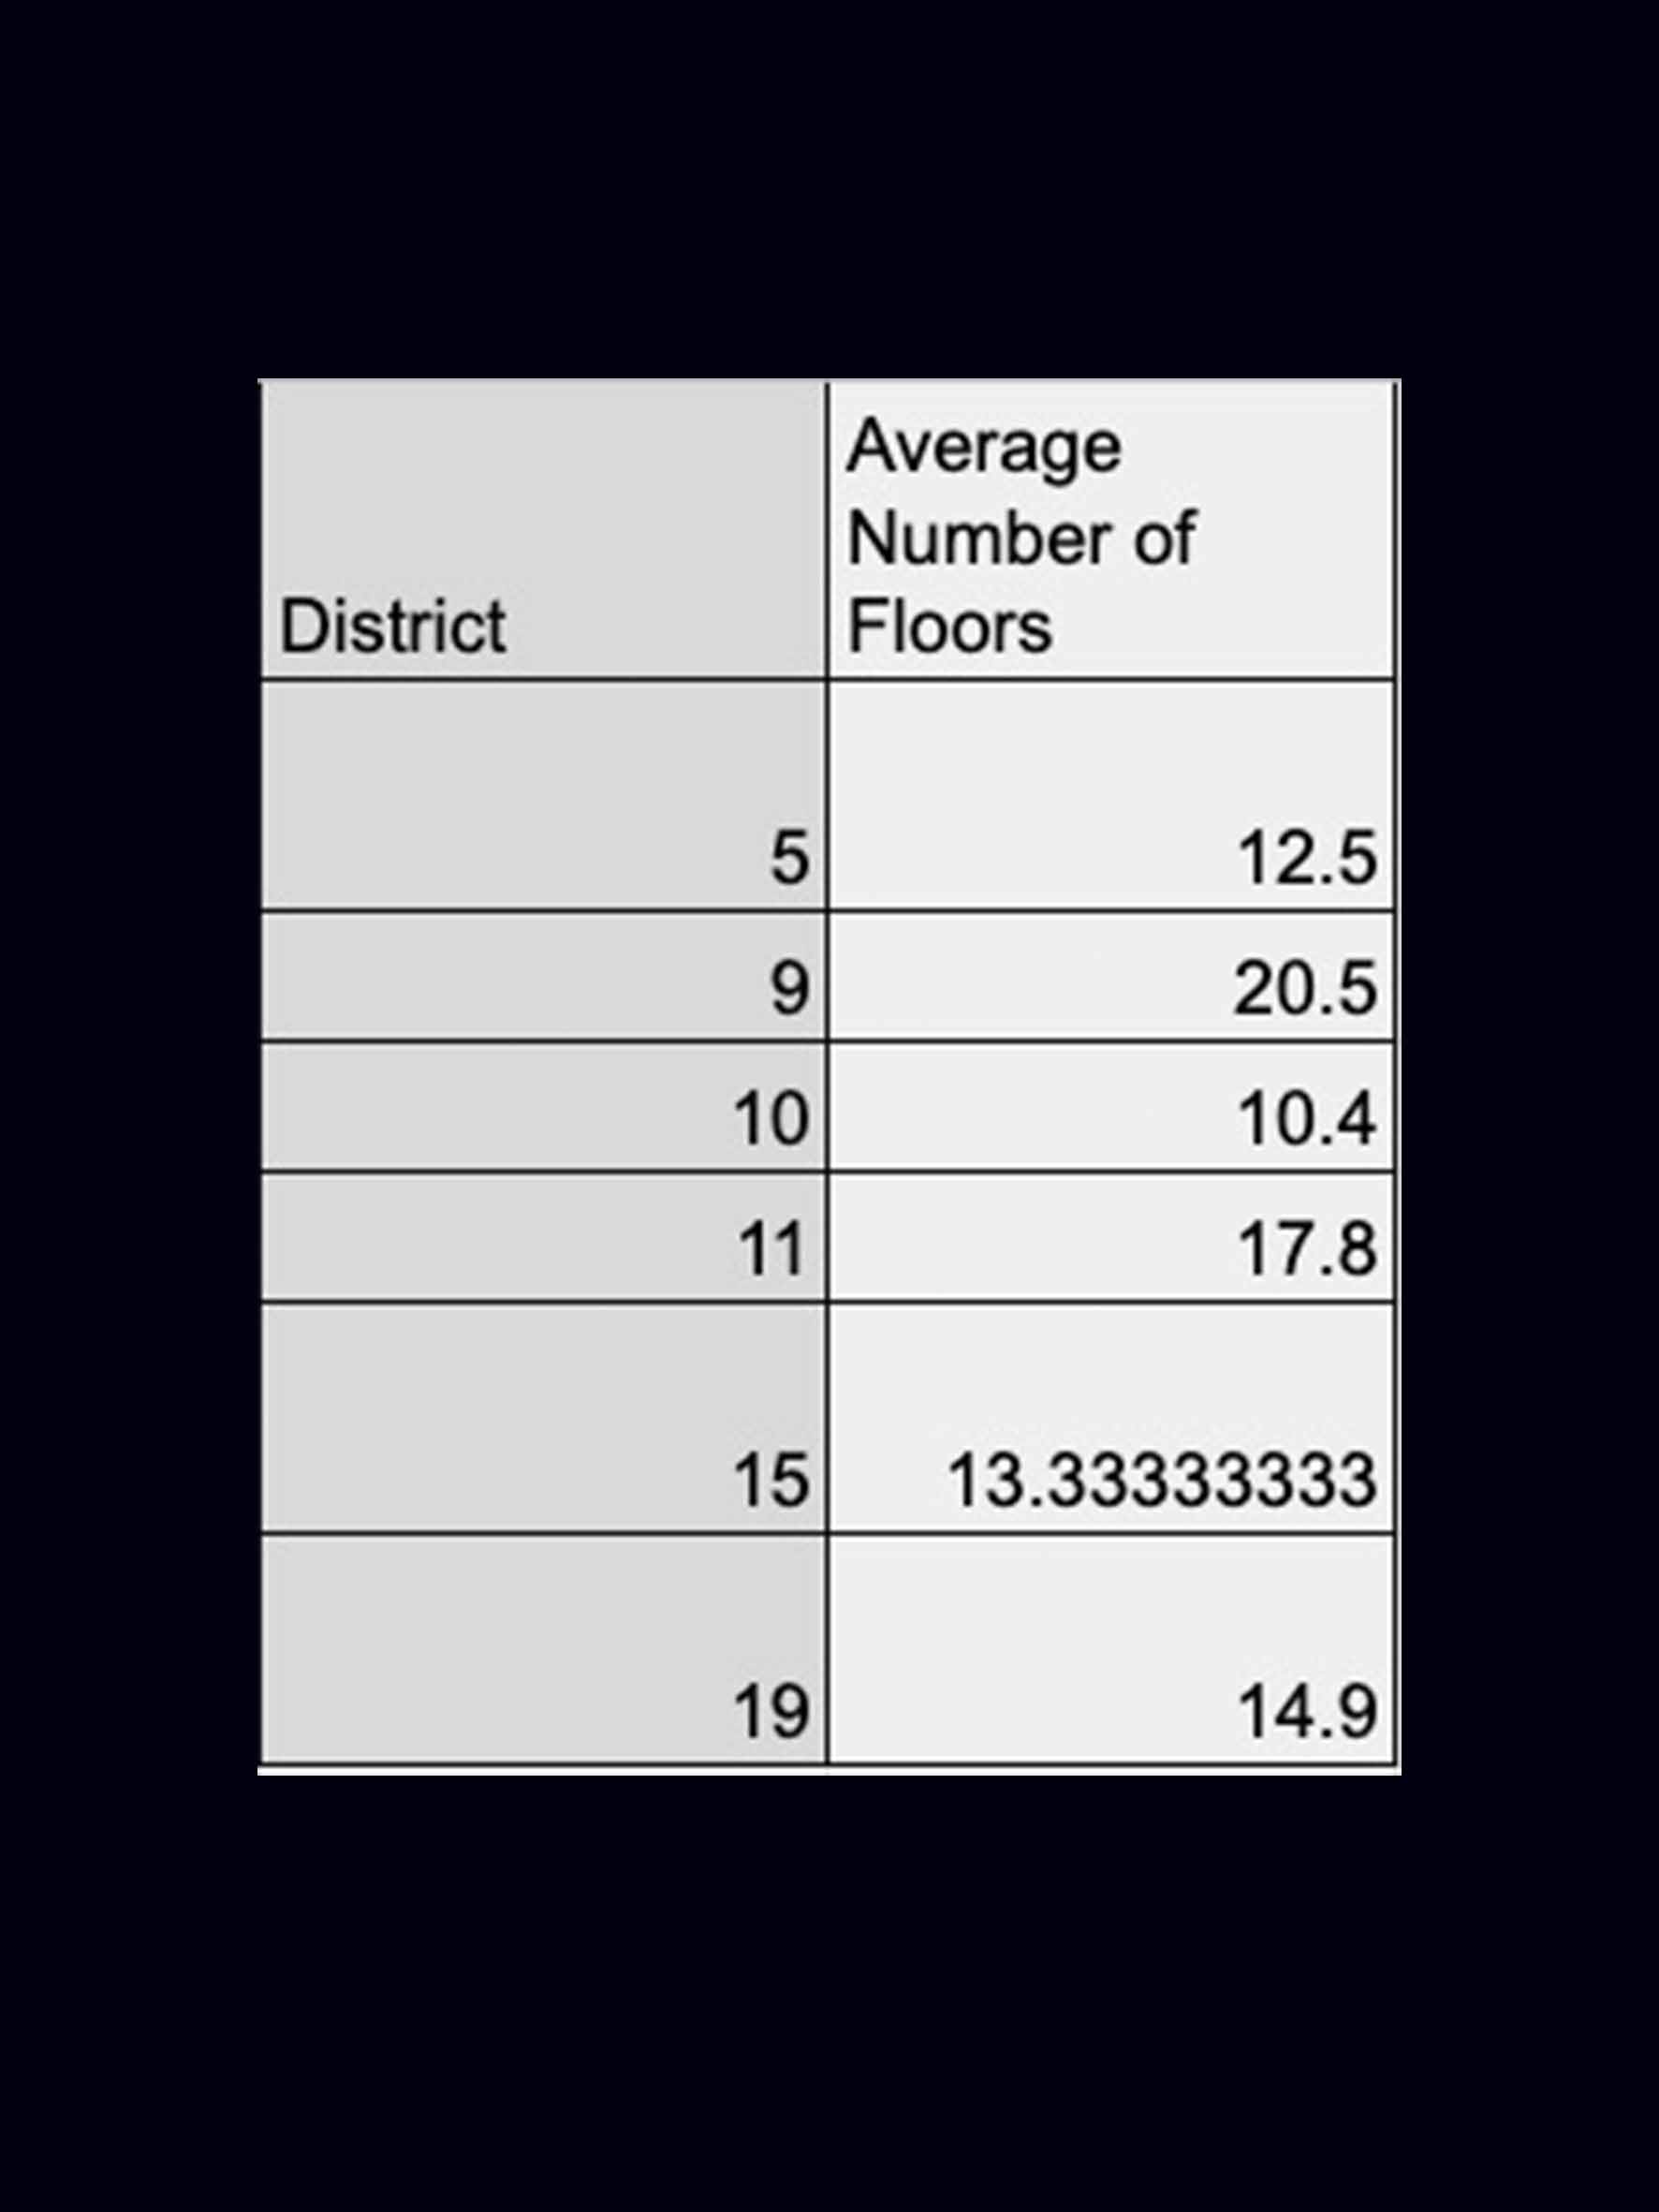
1. Average (Mean)
This was done by adding all the numbers from each district and finding the average figure.
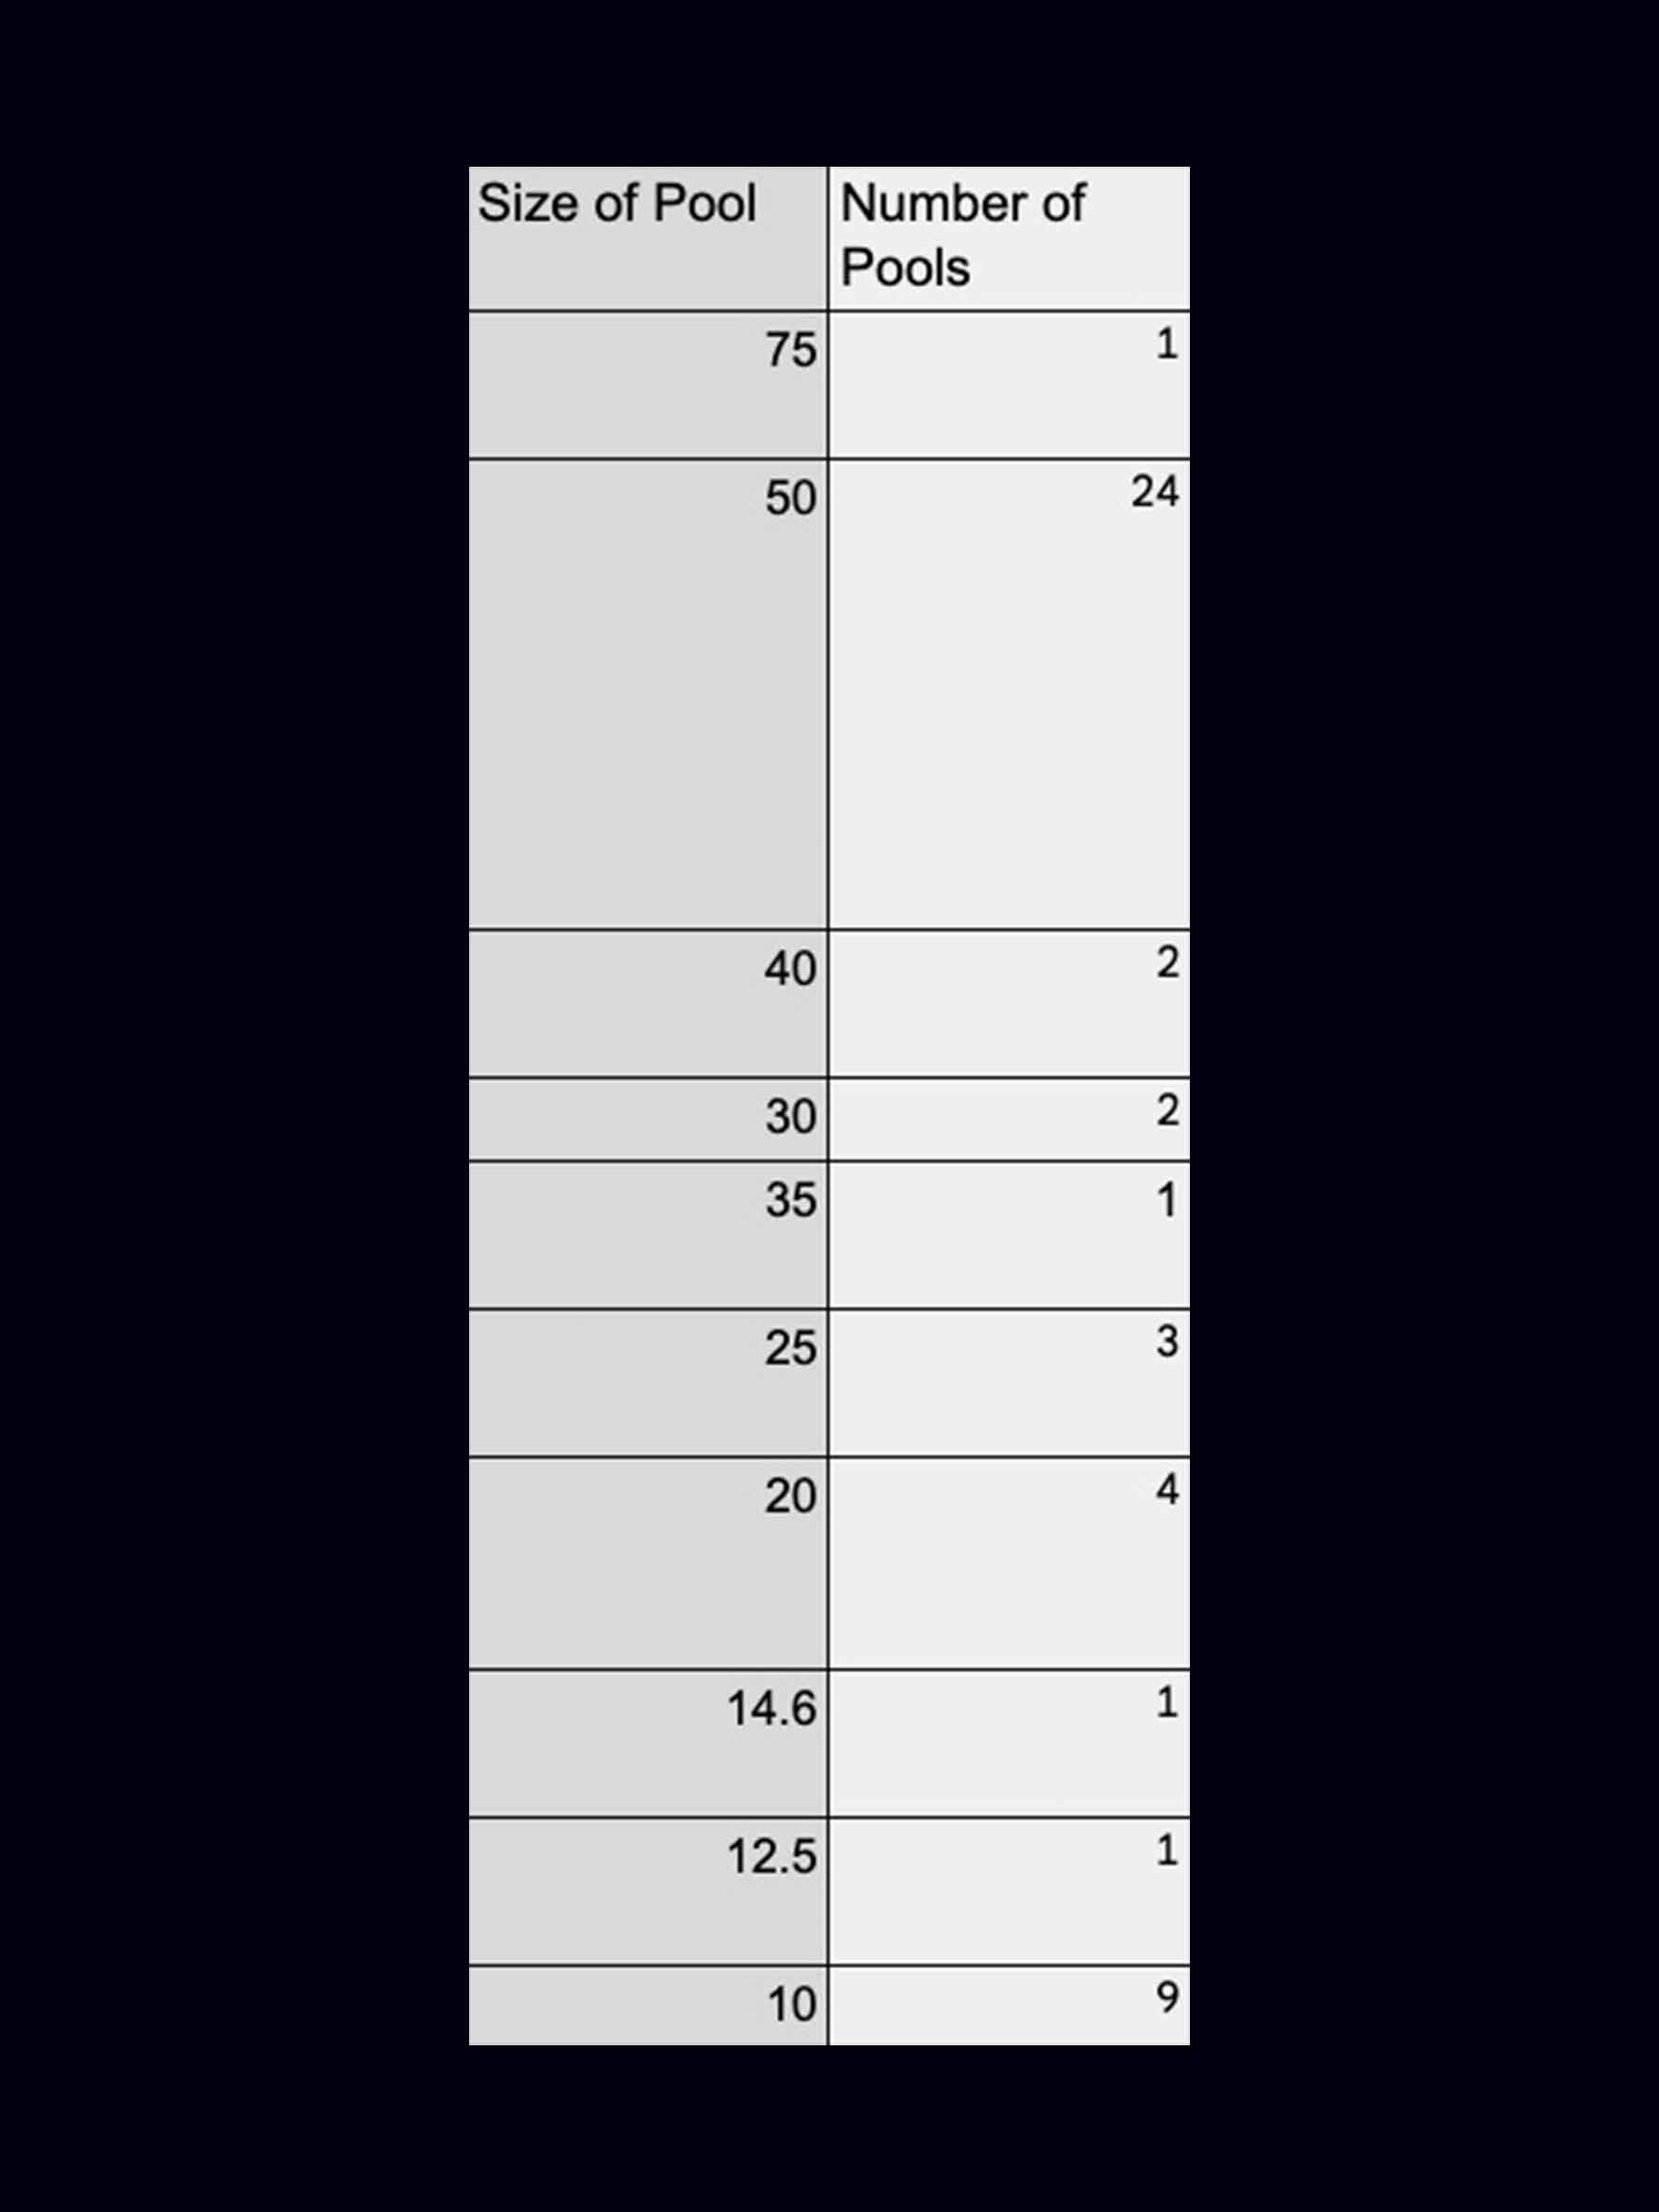
2. Quantity
This was done by adding up the number of condos with a certain pool size, allowing us to gain insight into quantity of different sizes.
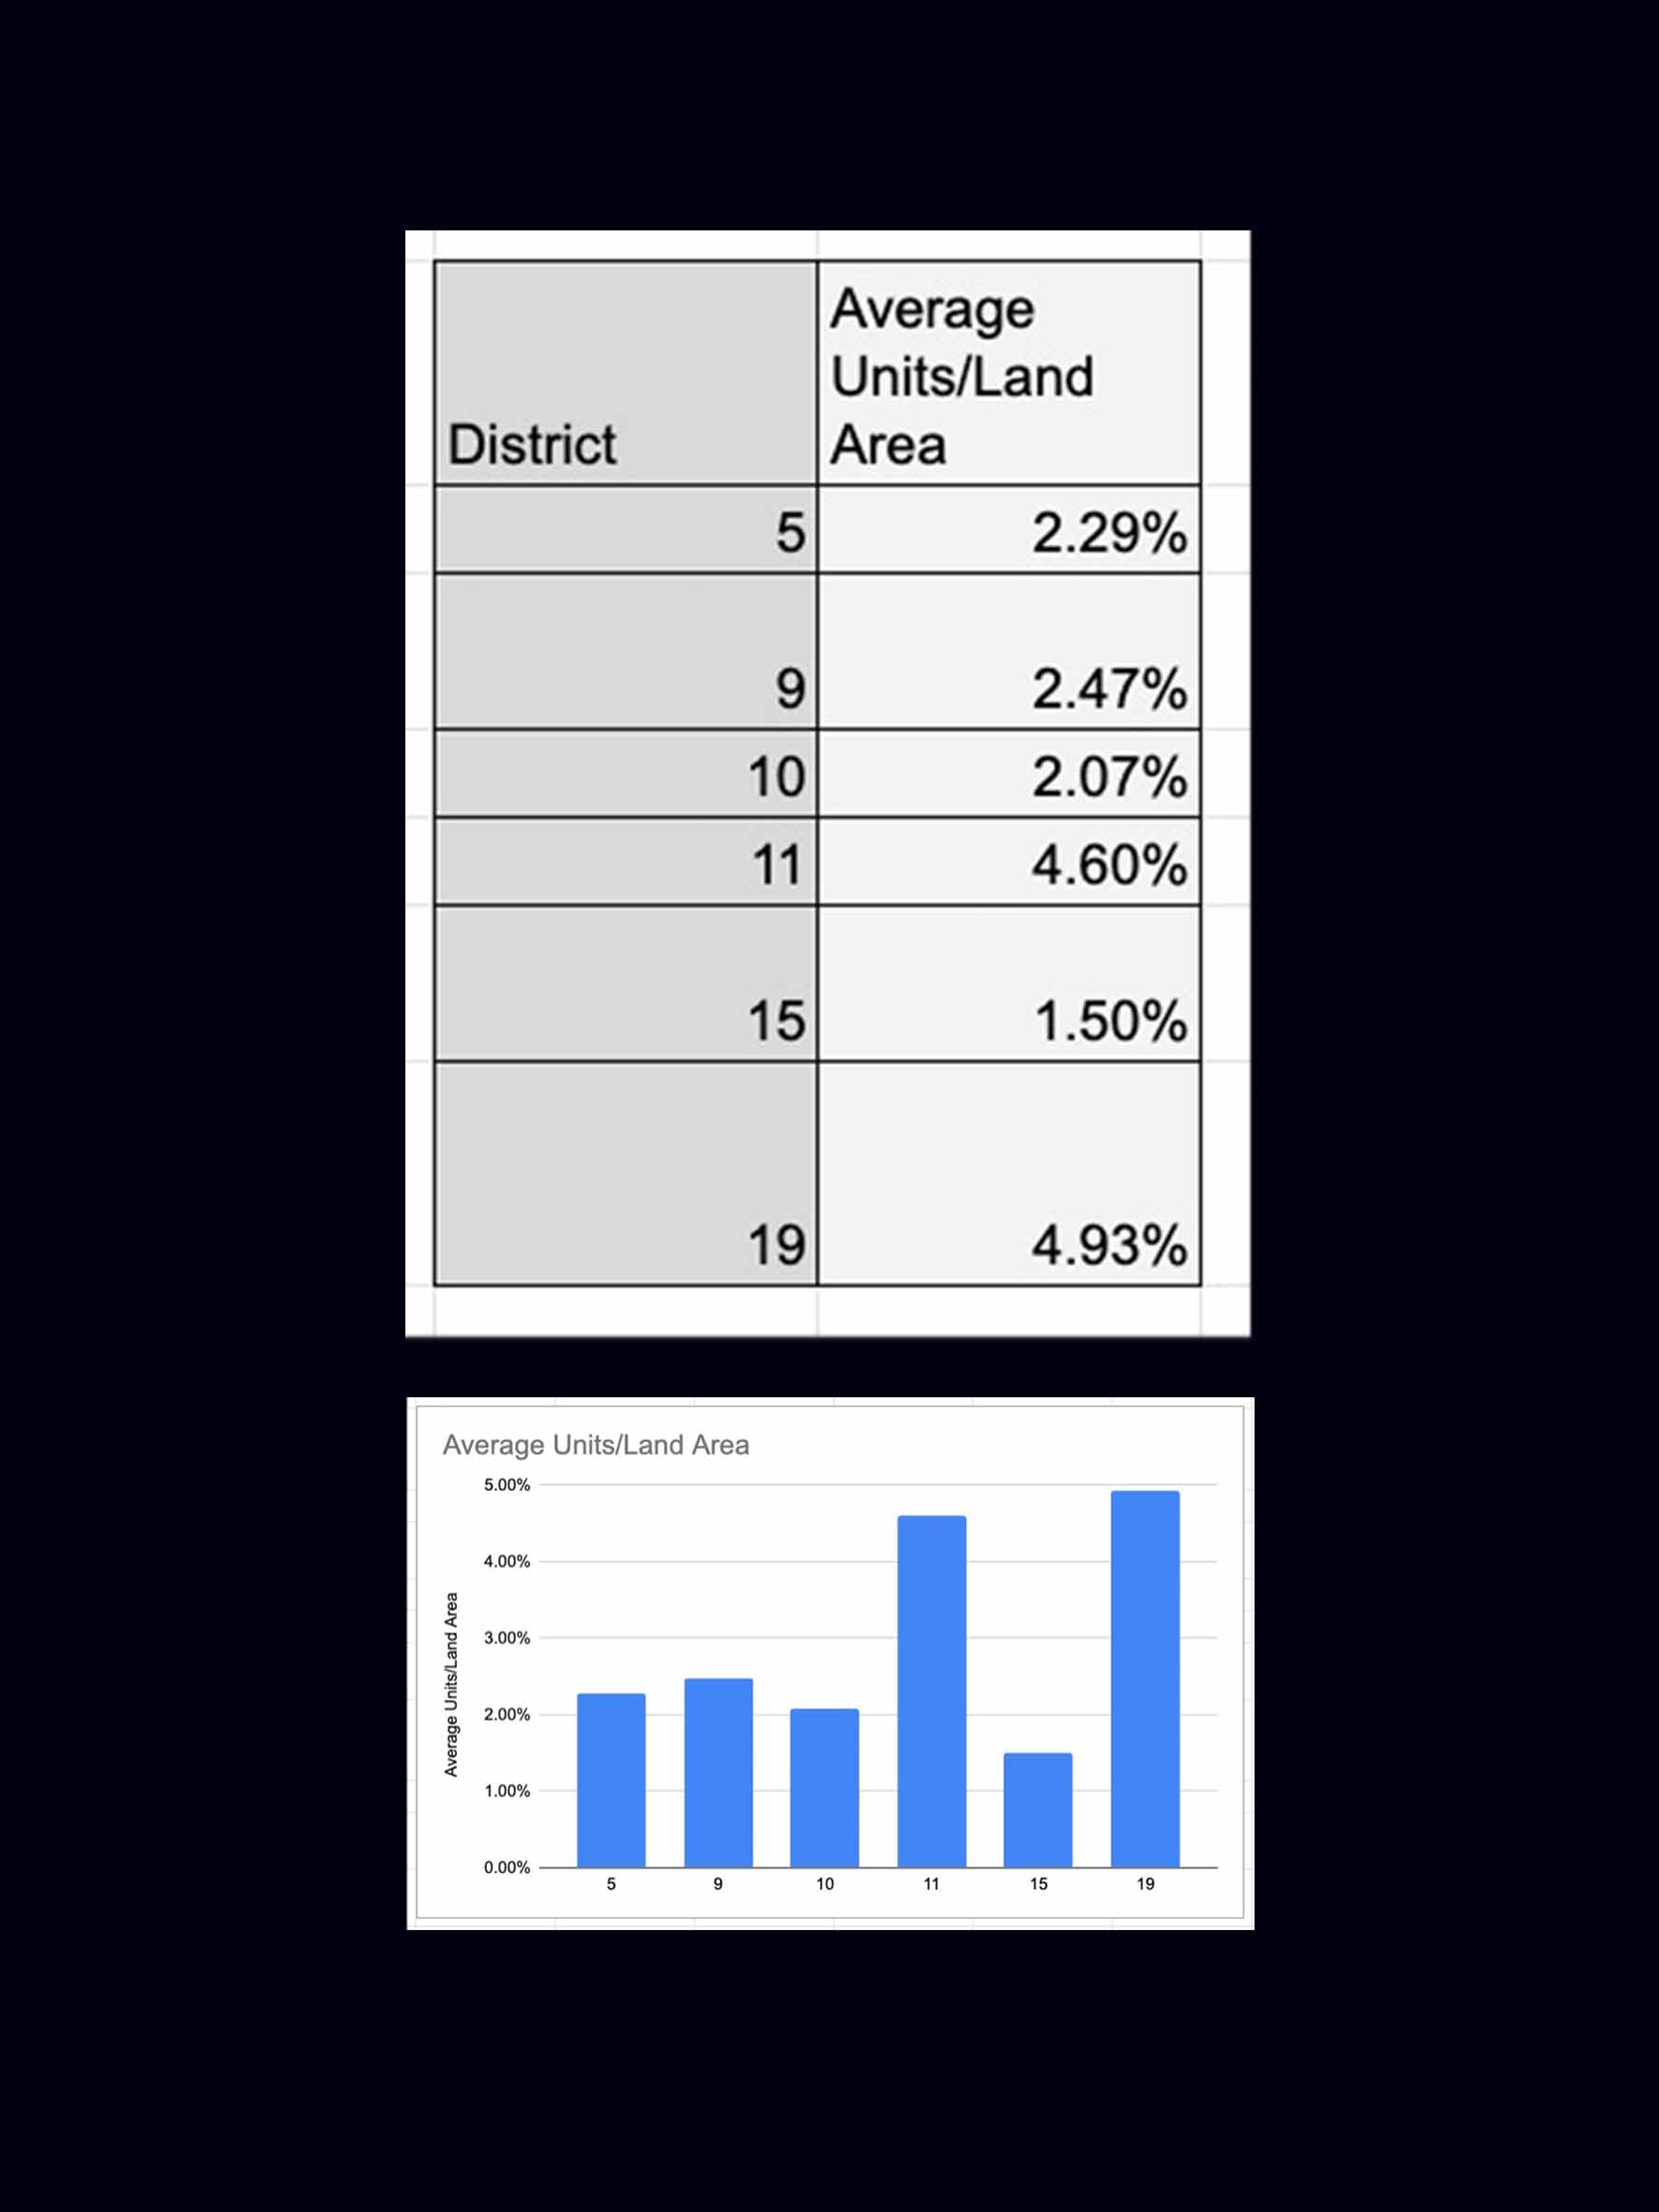
3. Cross-Analysis
Analysing different data sets to make further analyses.
External Data Sources
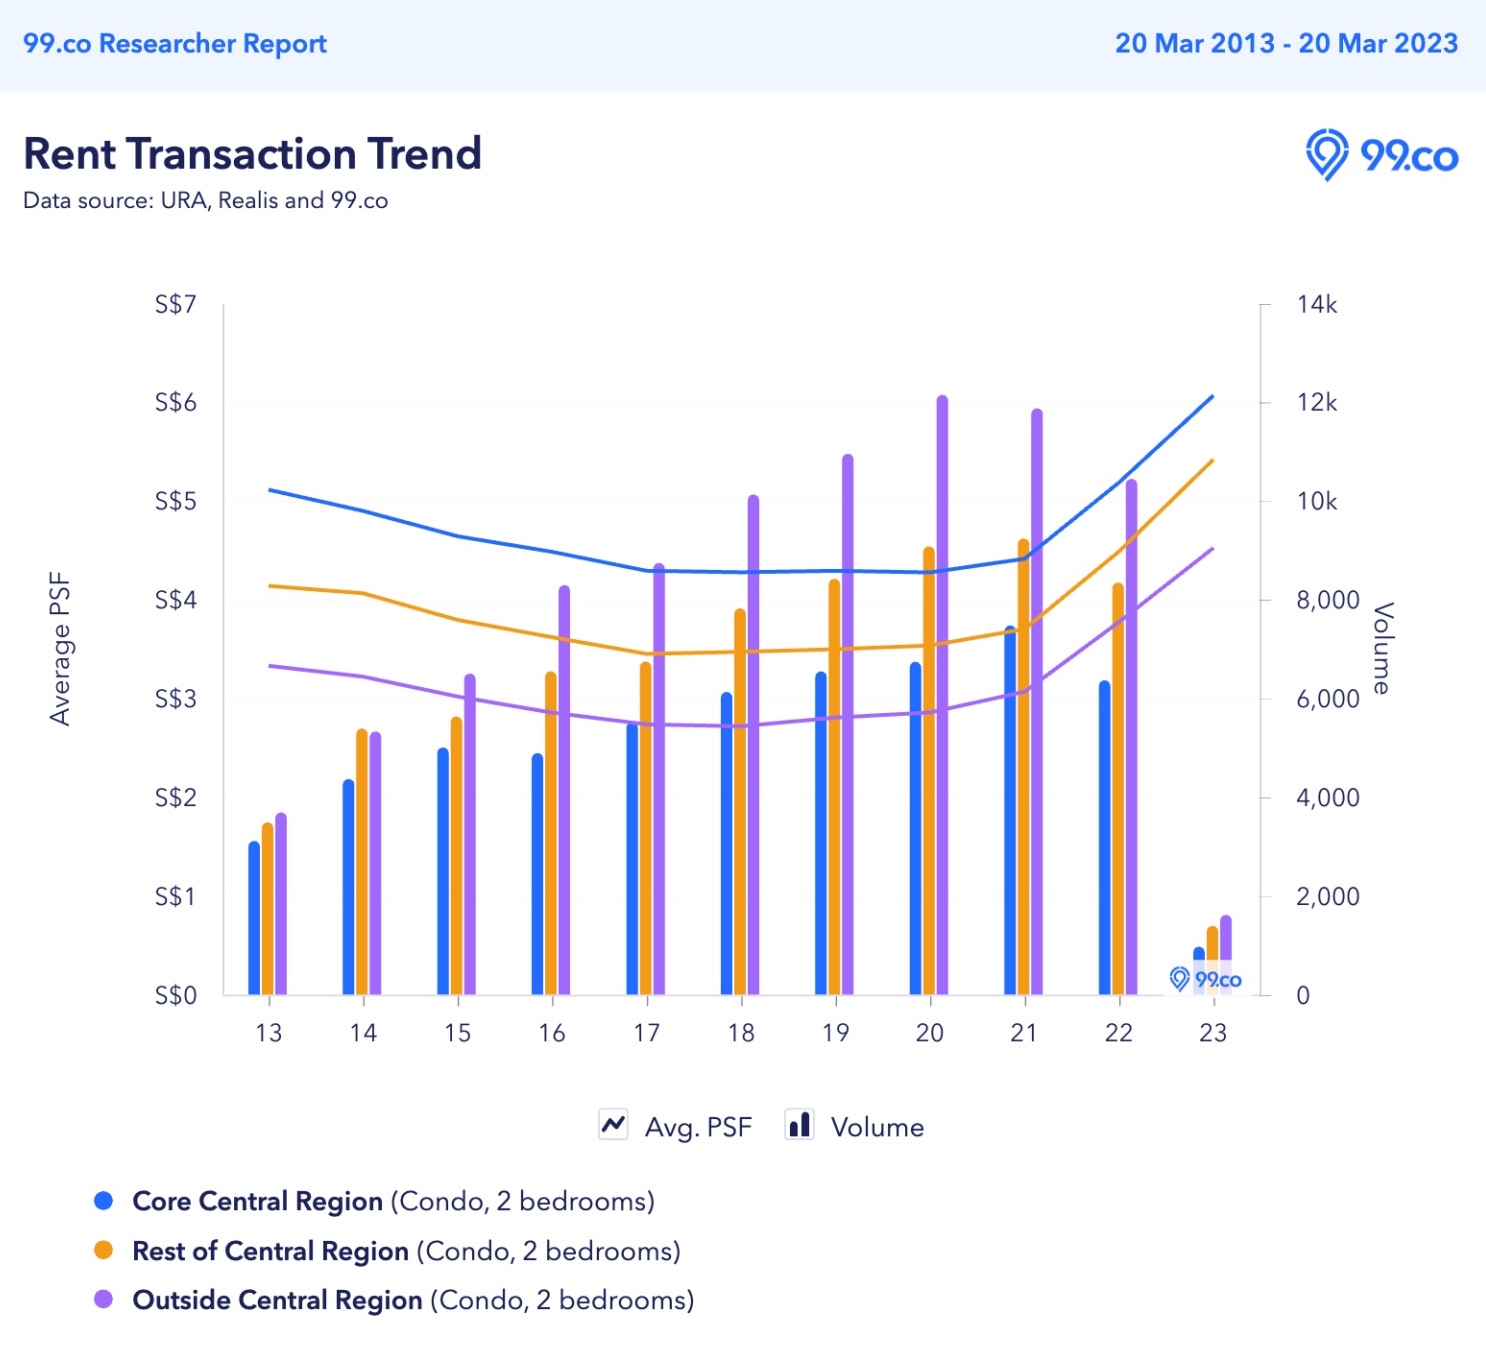
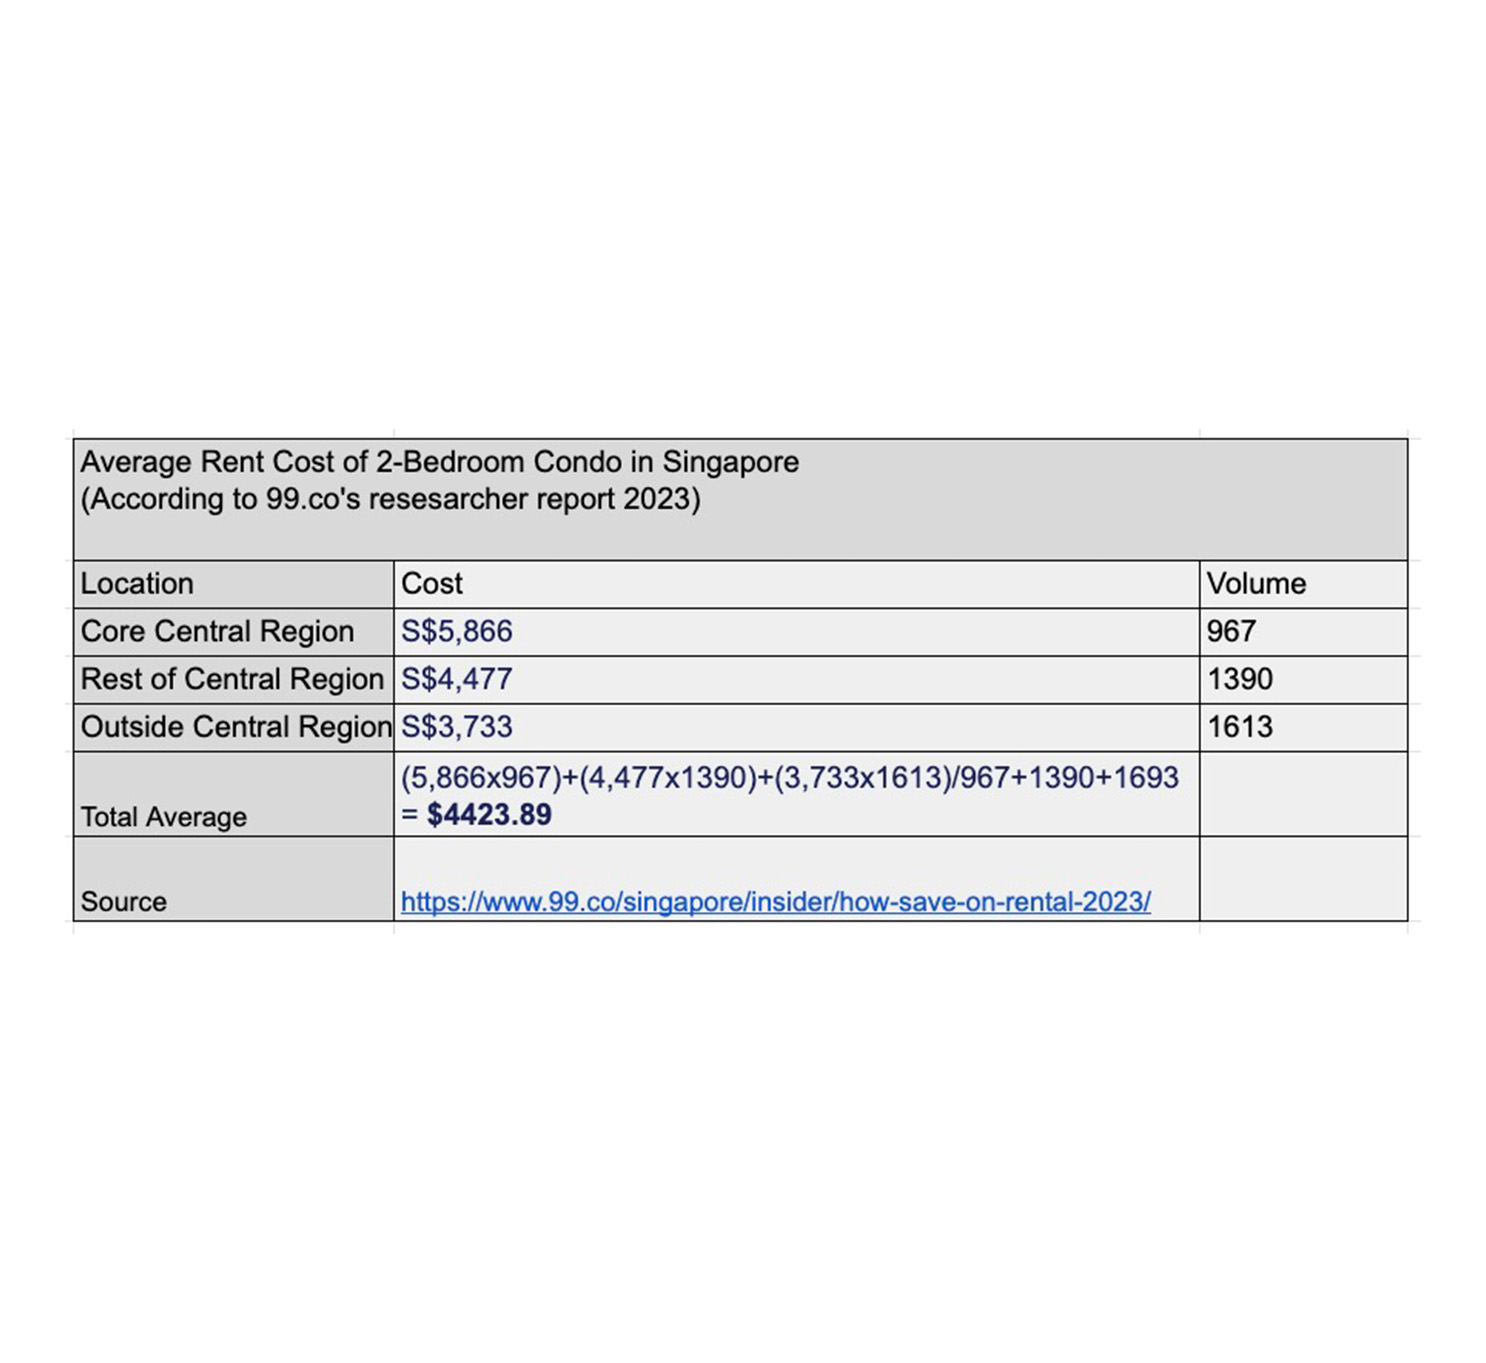
To further understand where the cost these condos stand in the grand scheme of things, we searched for external data from 99.co to find the average rent price of a 2 bedroom apartment across the whole of Singapore.
Artefacts
We decided to construct an imaginary real estate development company as our device for satirical commentary.
This was carried out in 4 stages.
1. Website
An introduction to the world of Casa D'Atas. This also acted as a central host for the rest of our artefacts.
2. E-Brochure
A presentation on the data-driven practices of Casa D'Atas. Where the bulk of the data presentation is.
3. Video
A video introducing our services briefly, also helped set the tone for the absurdity of the project.
3. Quiz
A quiz that helps the audience find the perfect home based on our data.
1. Website
The website served as an introduction to Casa D'Atas, as well as directed visitors to view the rest of our artefacts.
Initially drafted in Figma, we established that we would have everything in one page so visitors could access everything in one go.
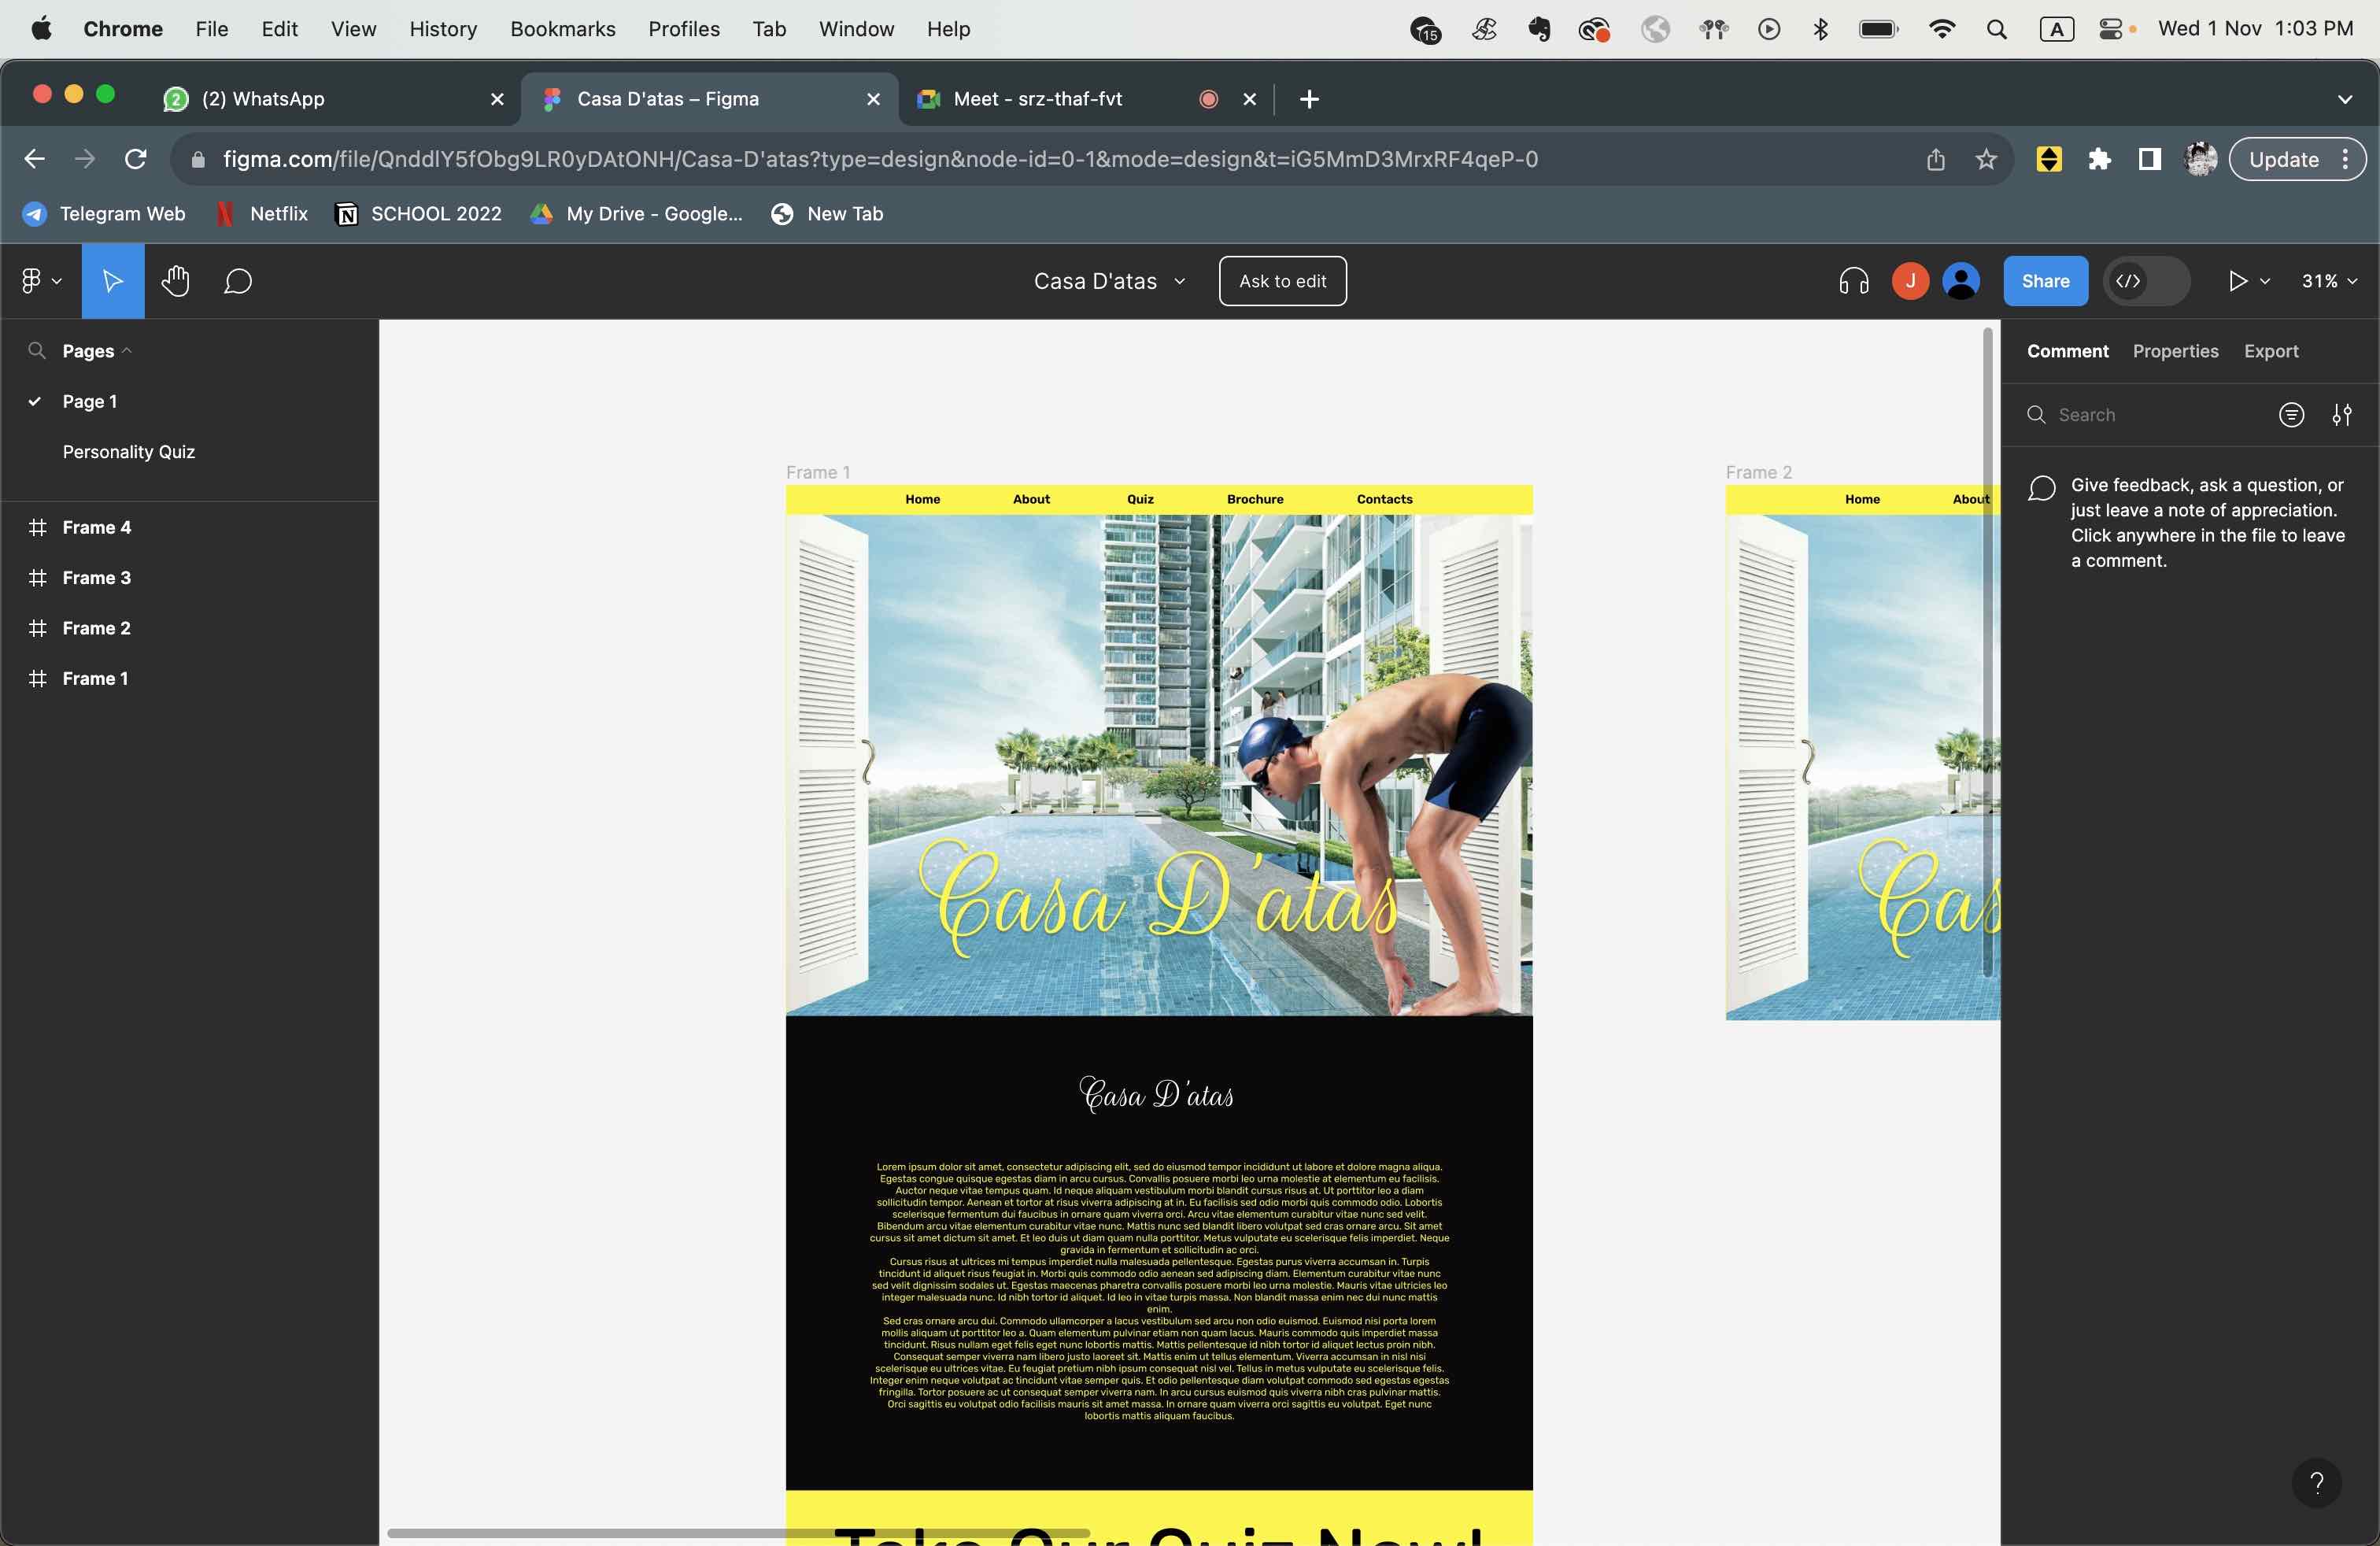
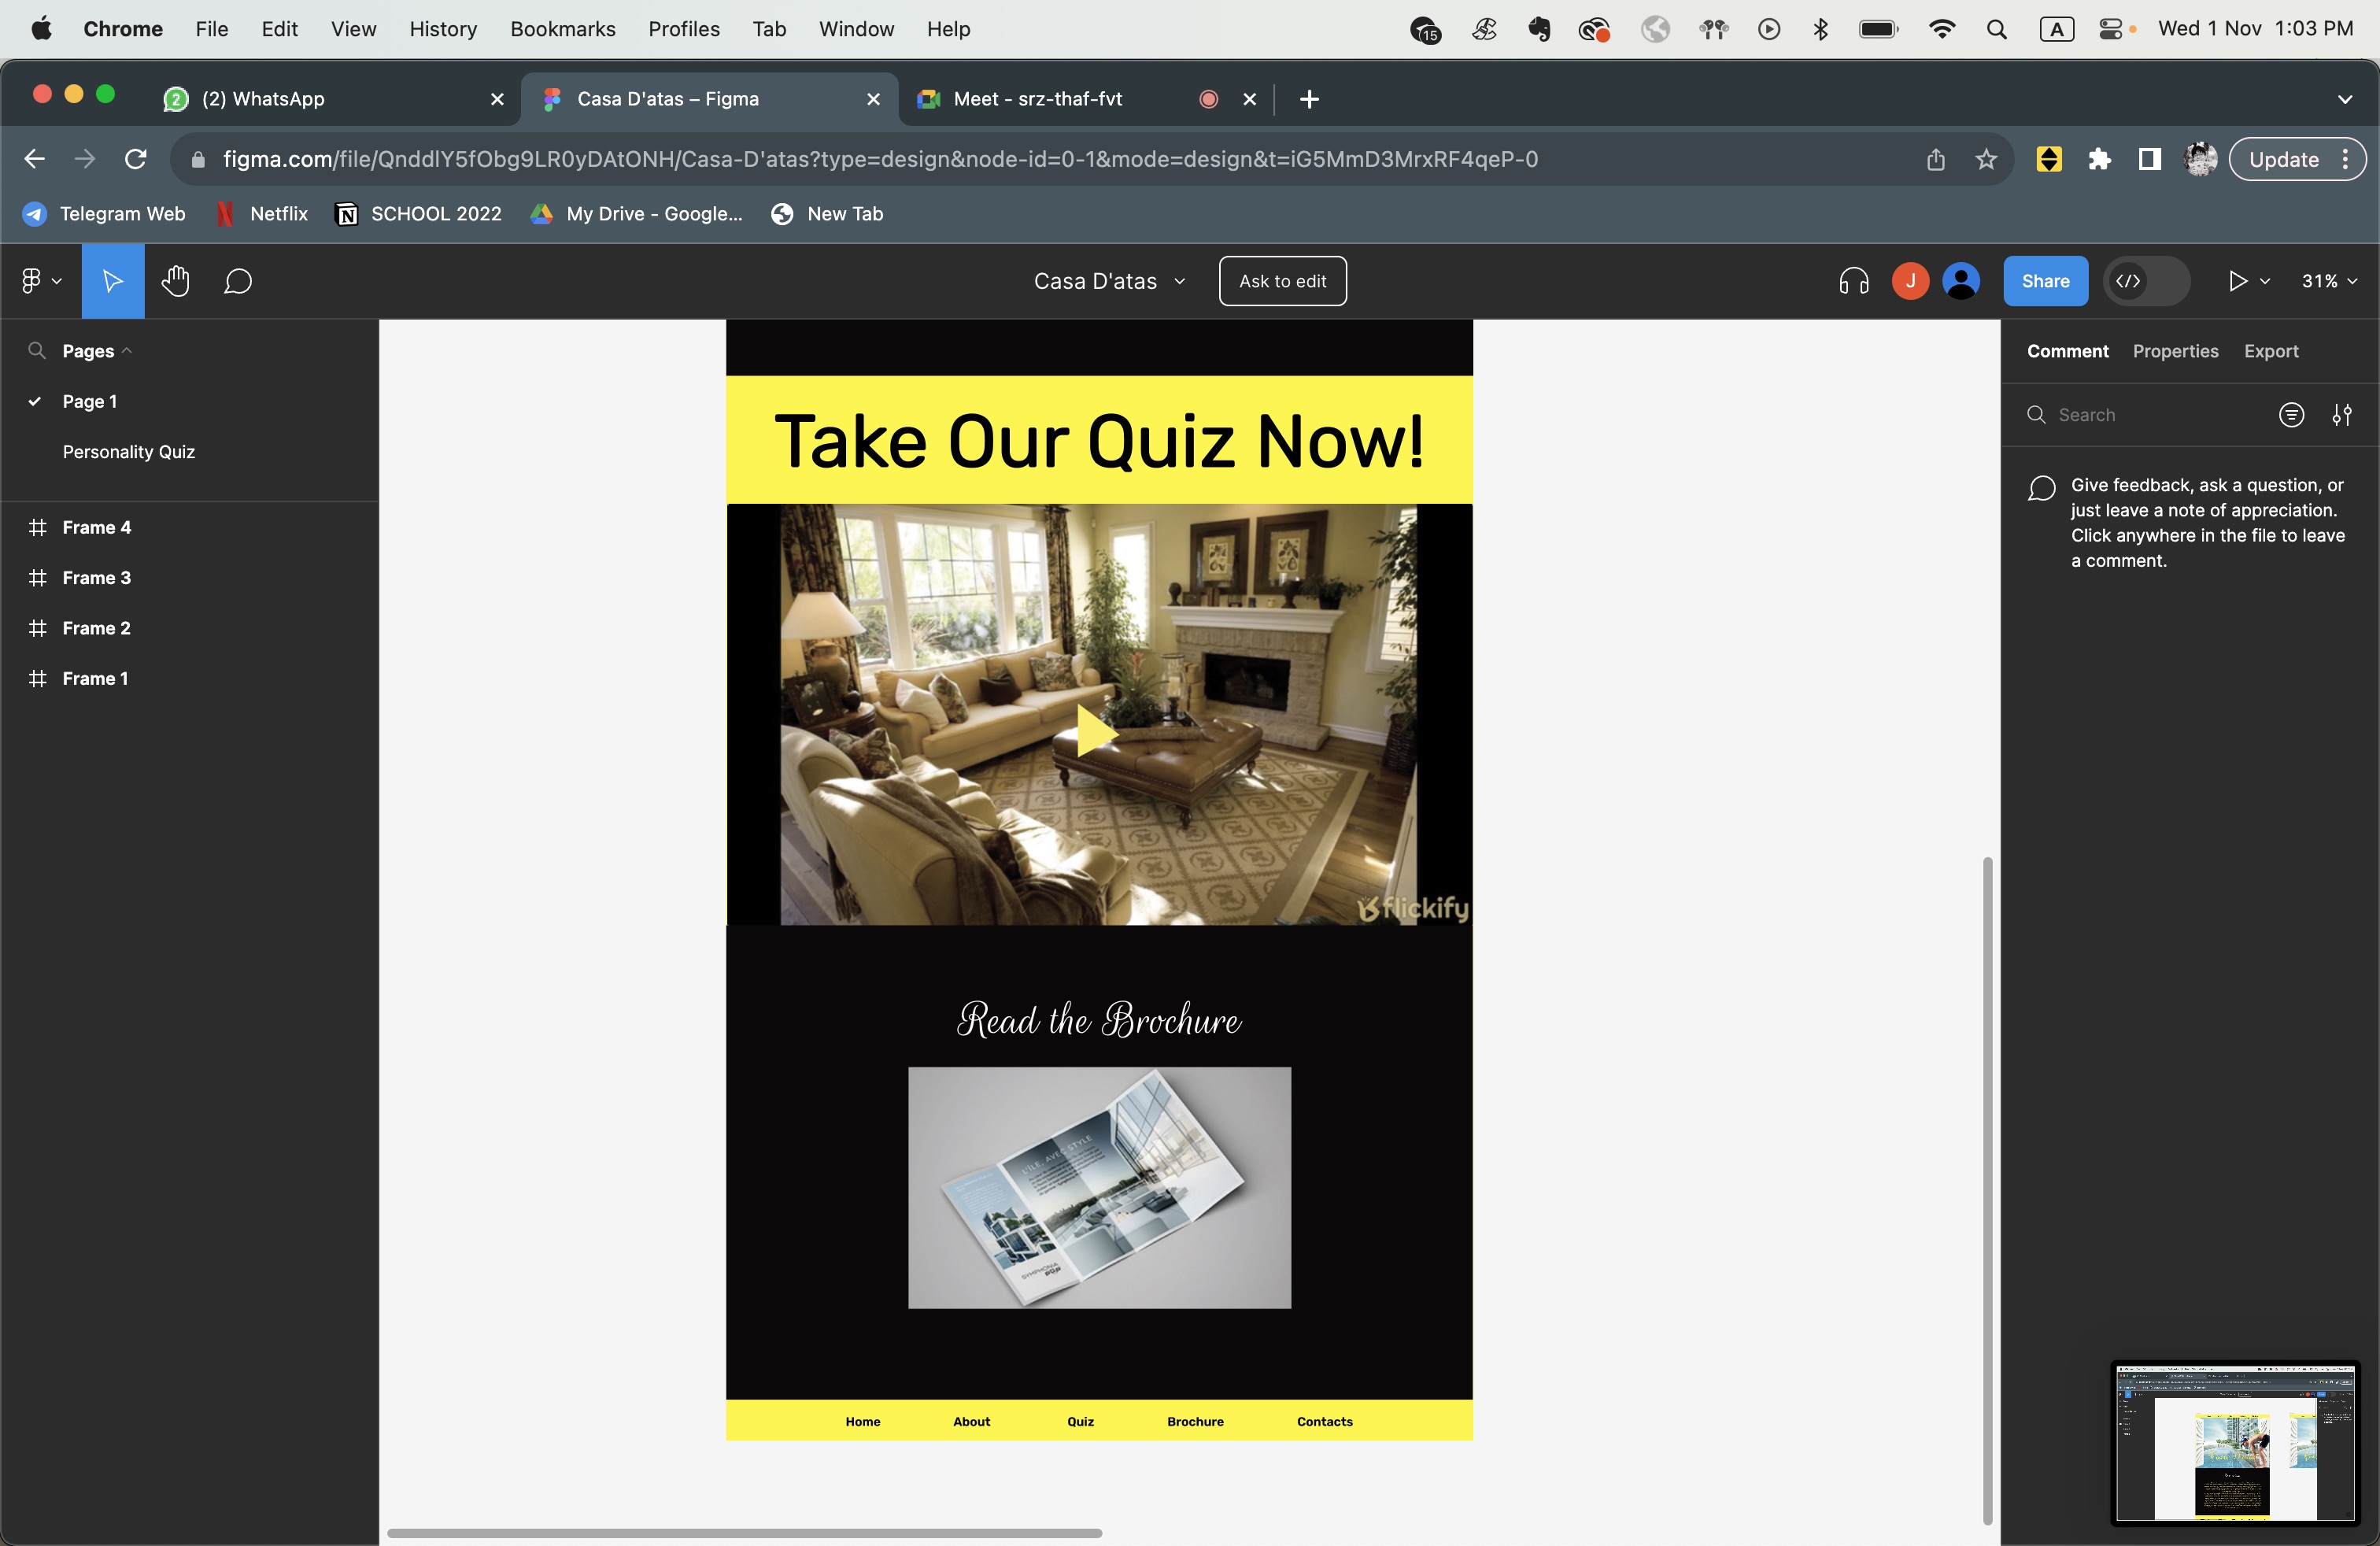
In the spirit of maximalism and camp, we included a flamingo float as the cursor. As the user scrolls down the site, they come across the video, as well as links to the E-brochure and the Quiz.
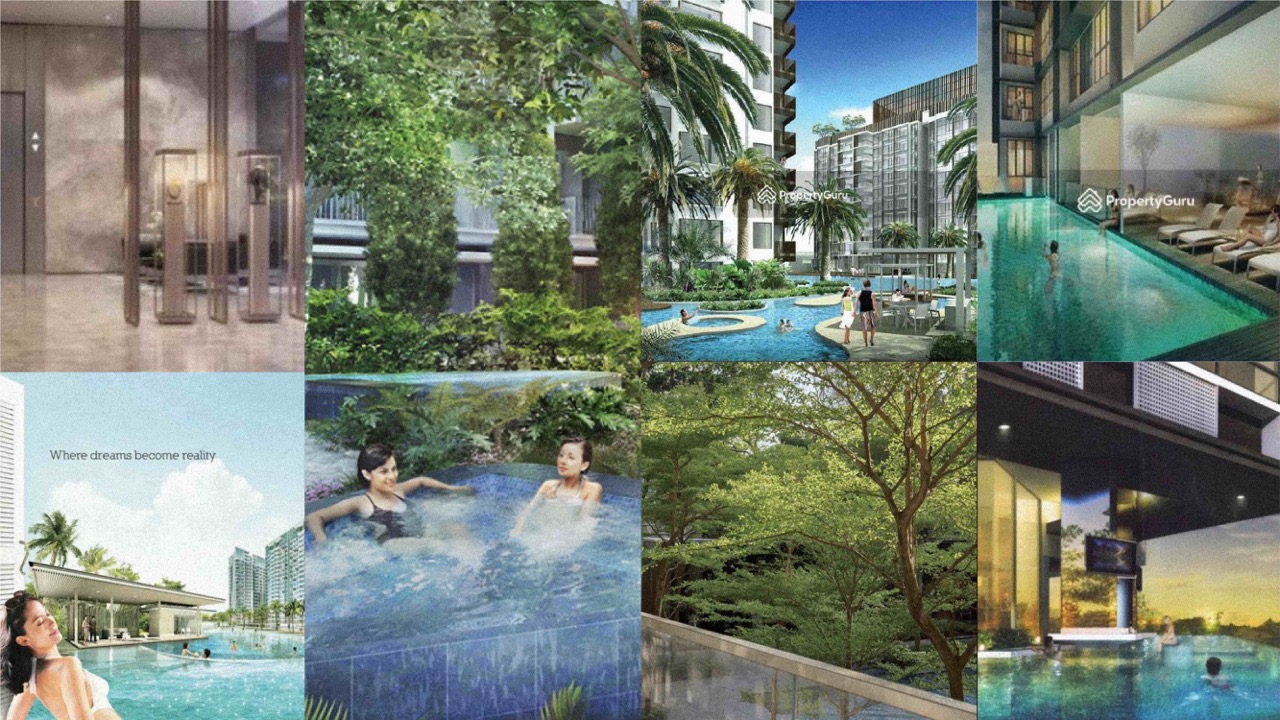
The image used for the landing page was an actual image sourced from The Shore Residences. It was perfectly cheesy enough, with palm trees and a sunset behind that creates the idyllic visual that we needed.
2. E-Brochure
The E-Brochure explained to the audience why we are a data-driven real estate development company.
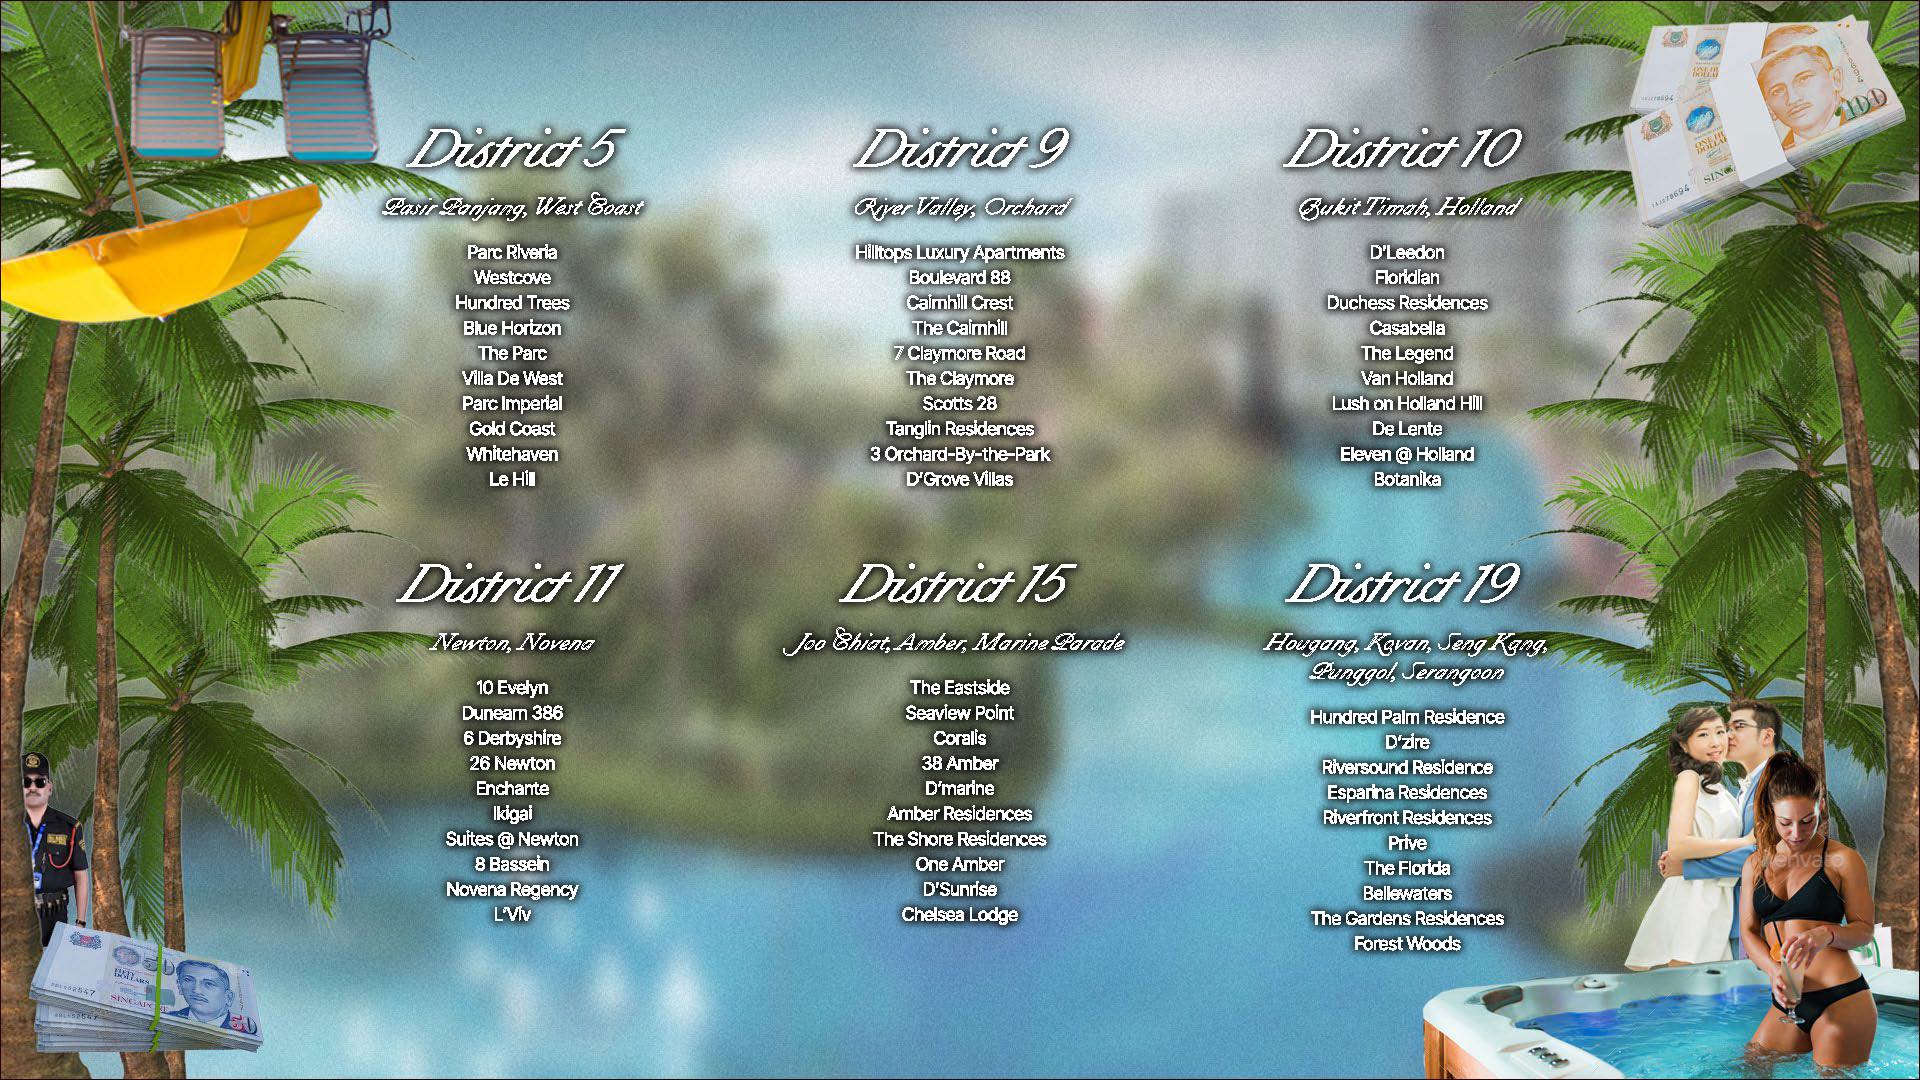
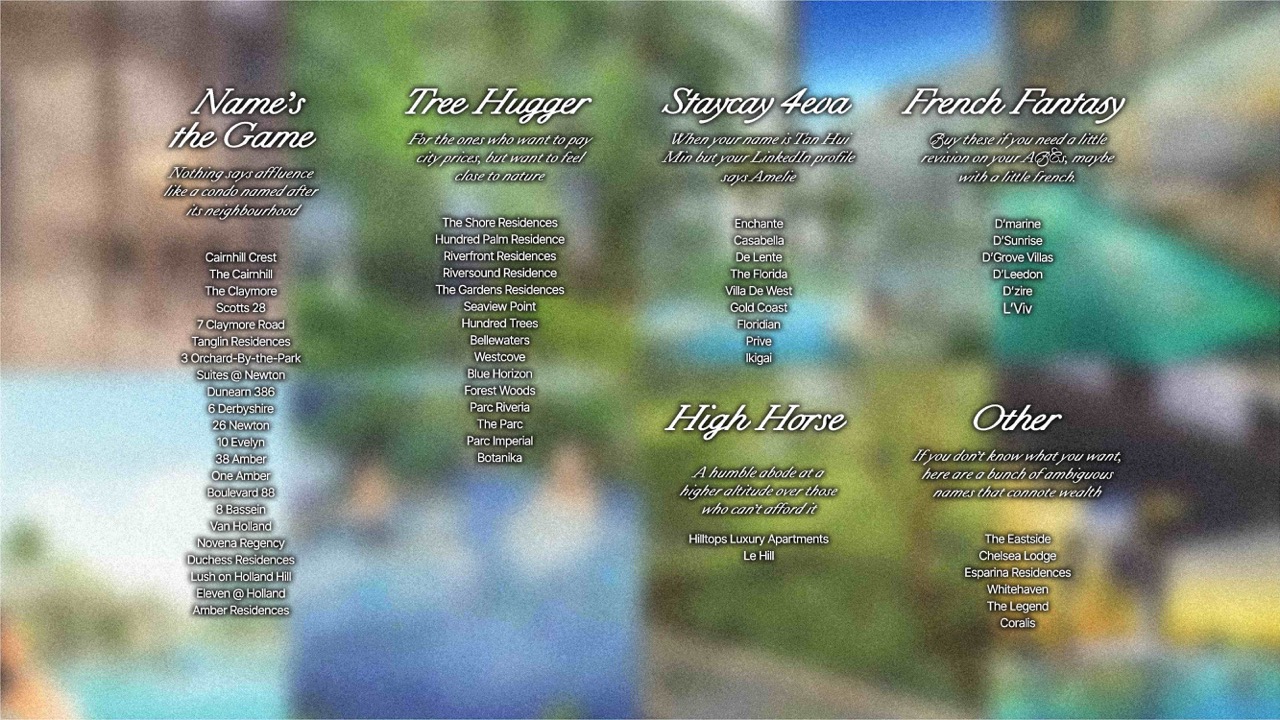
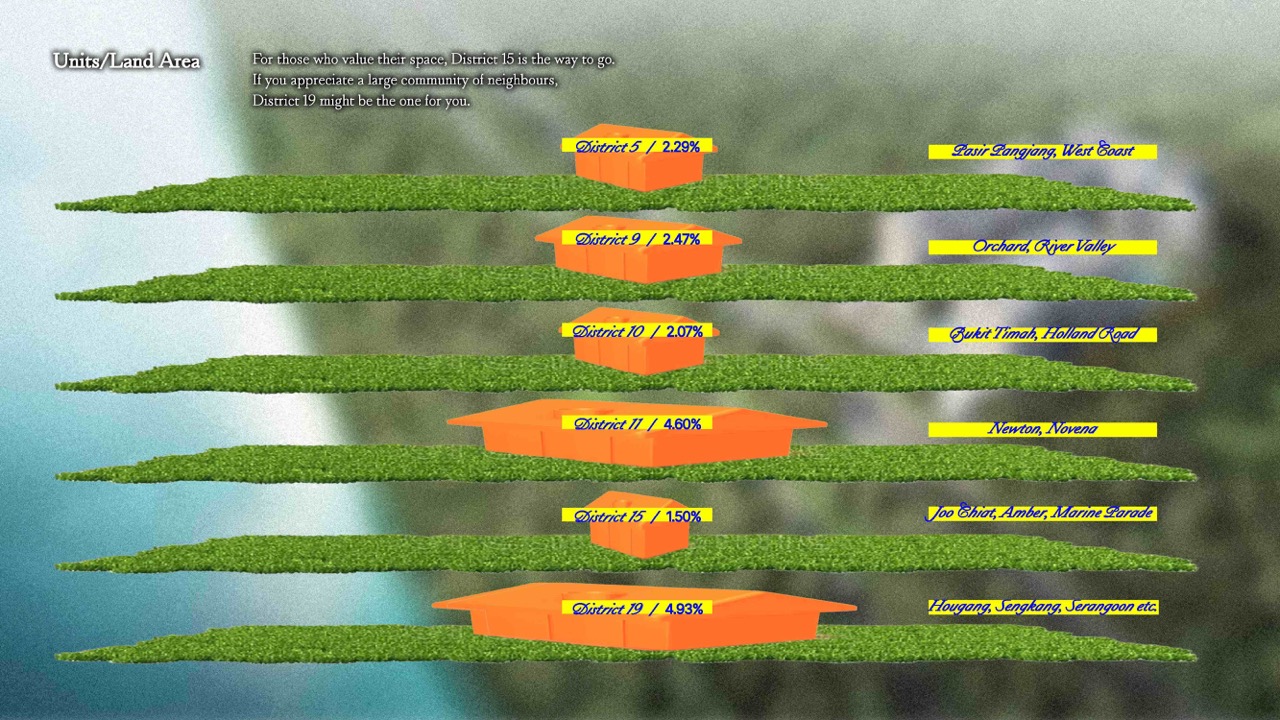
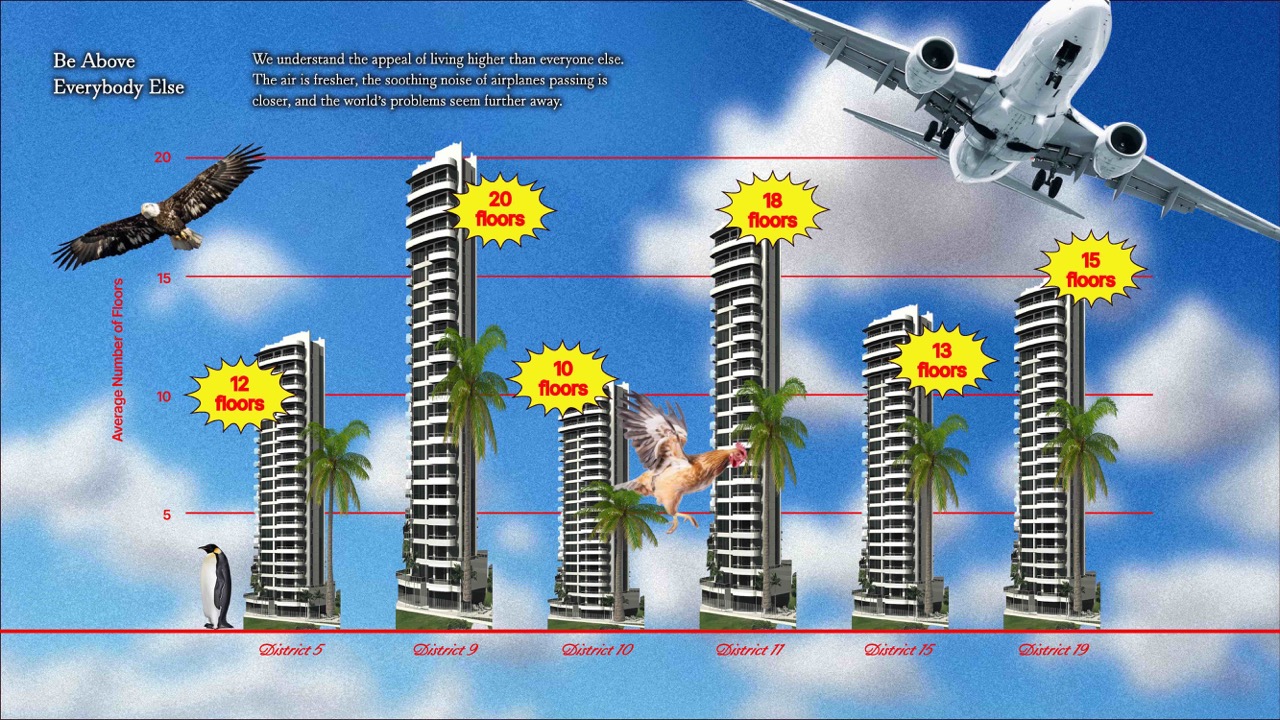
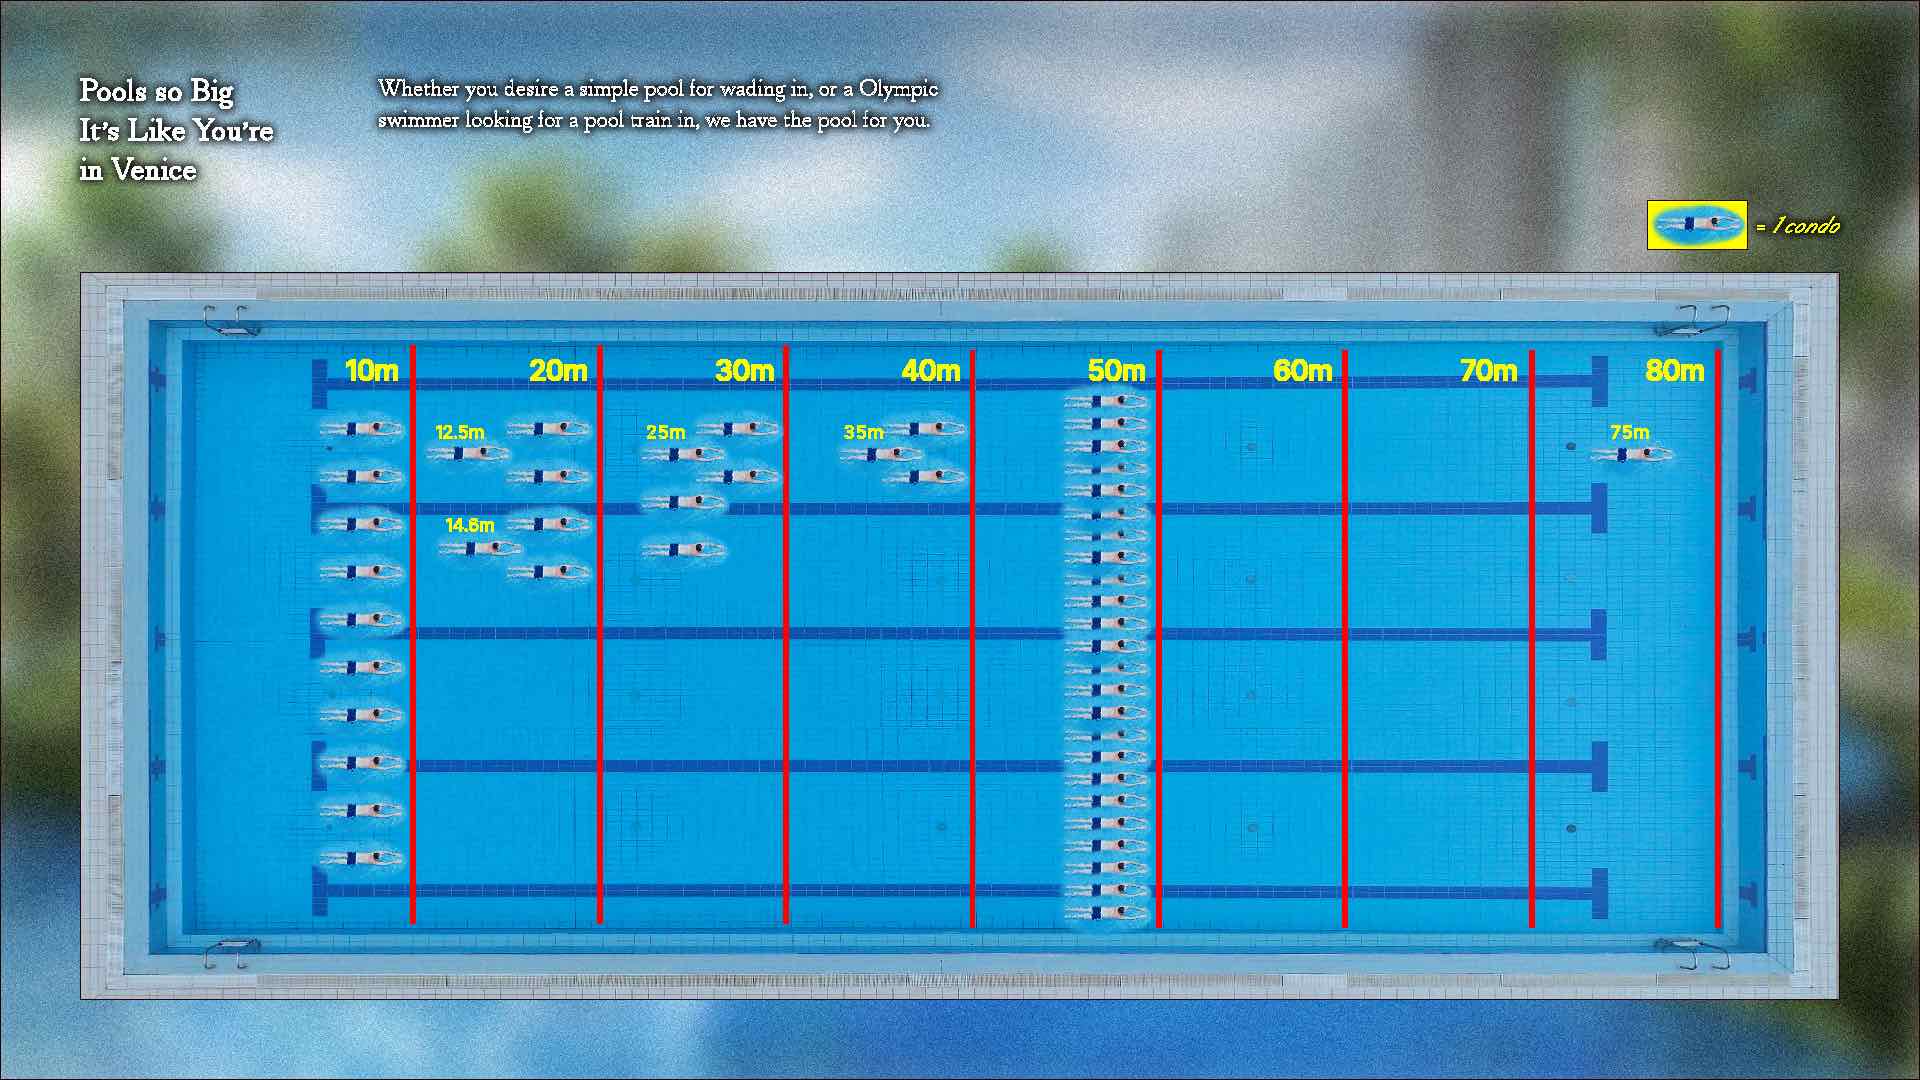
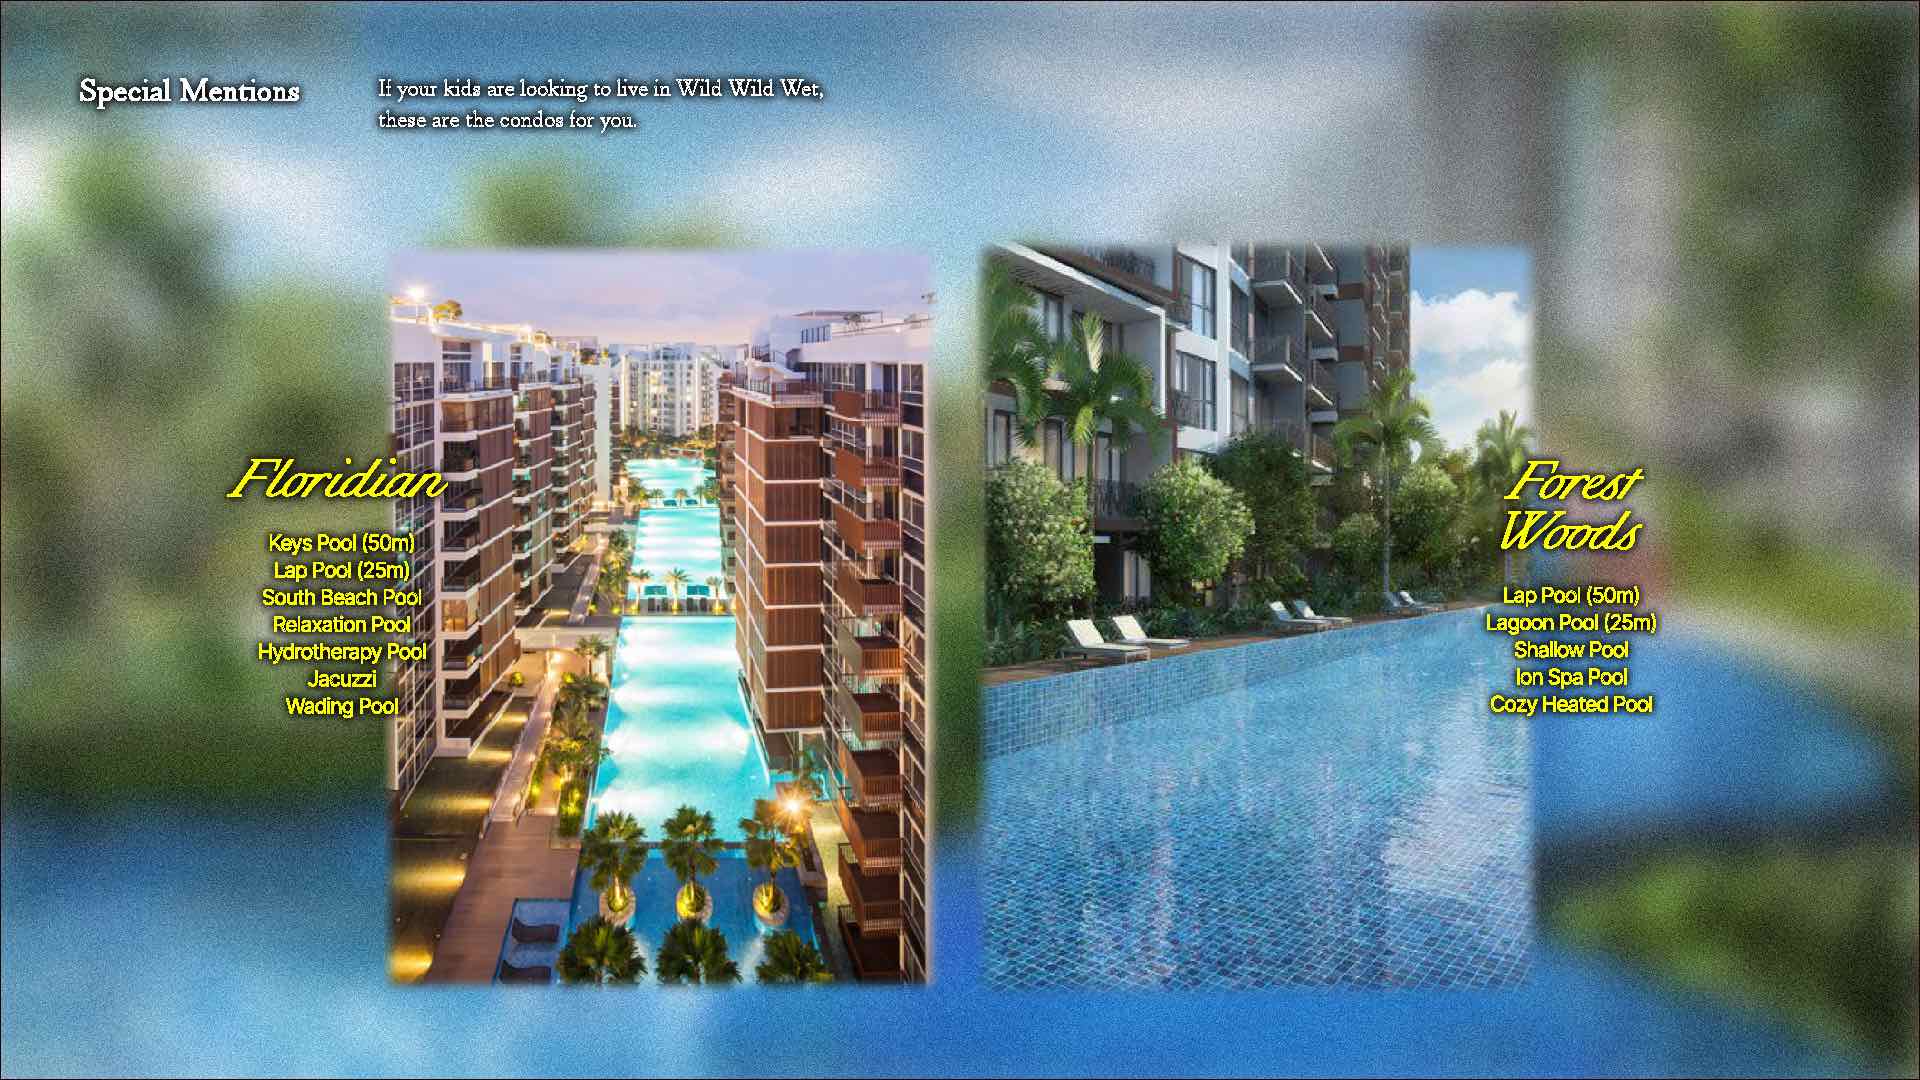
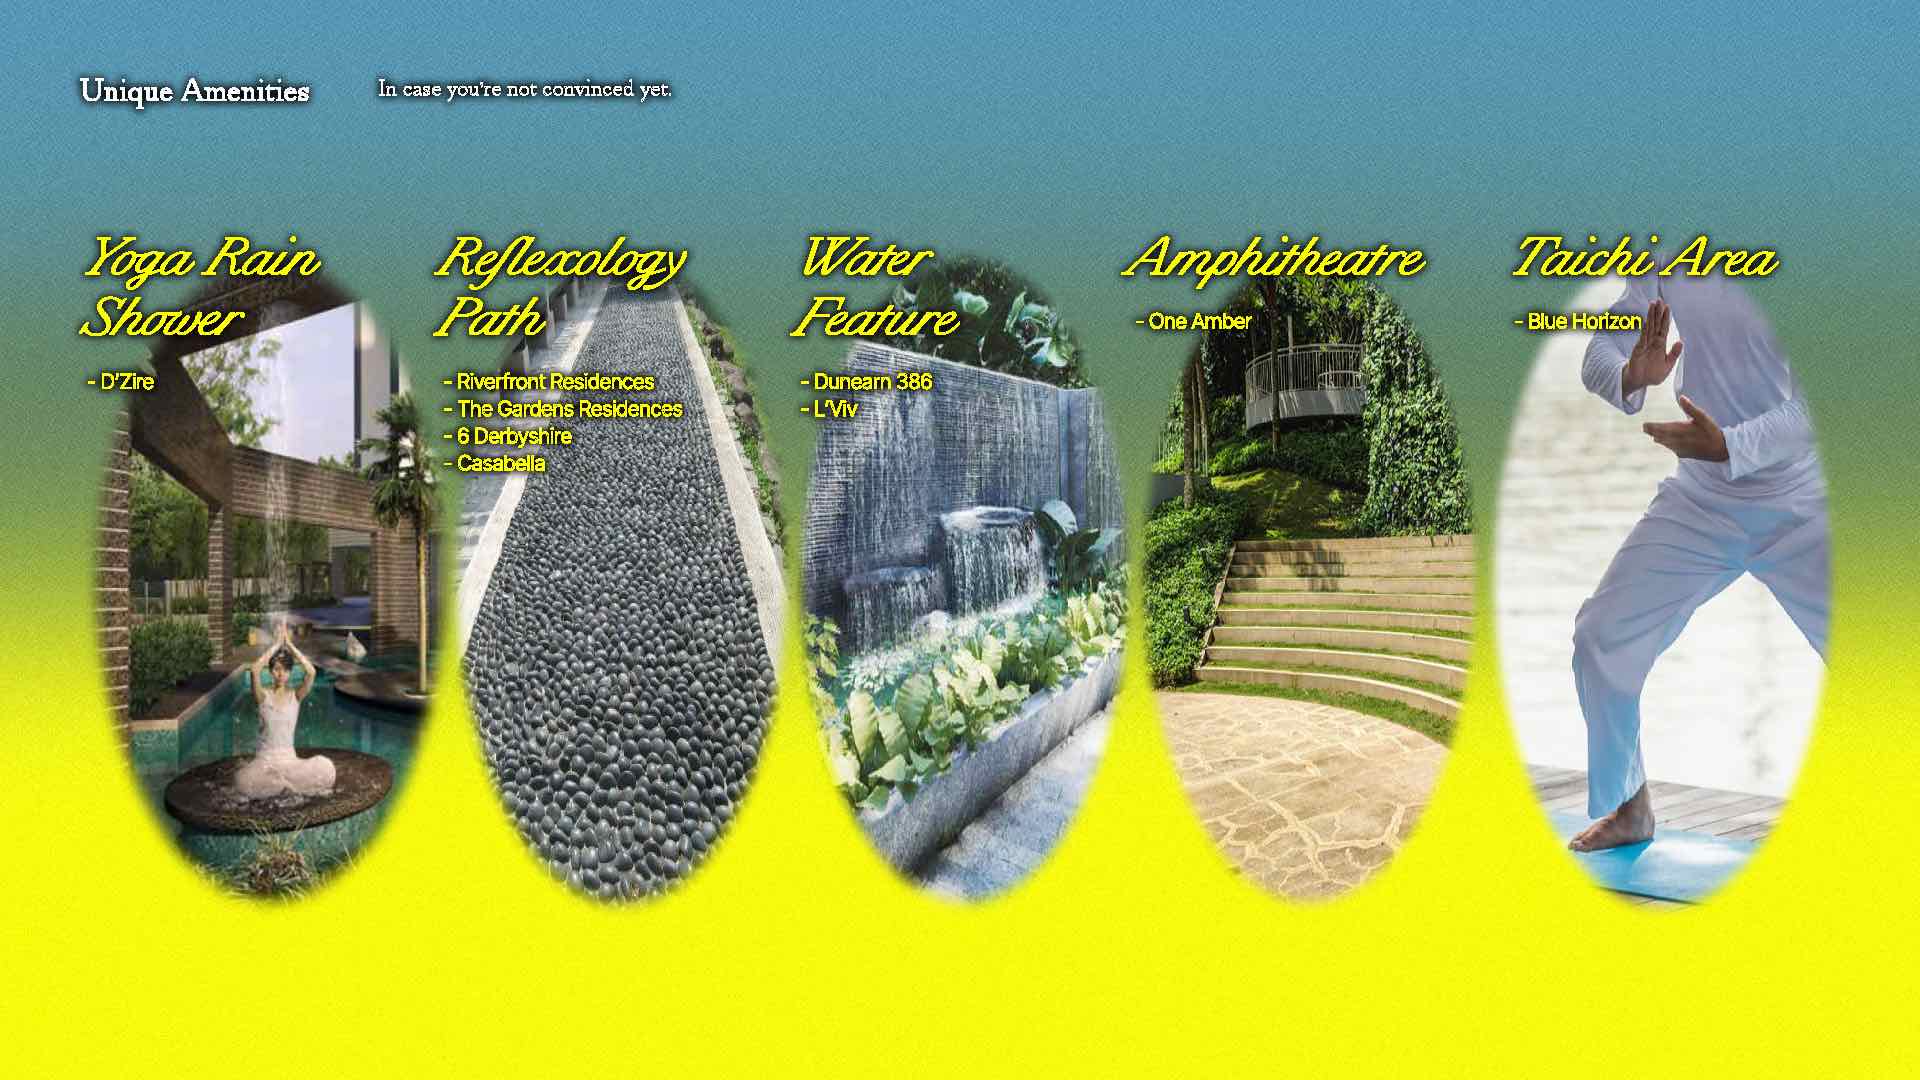
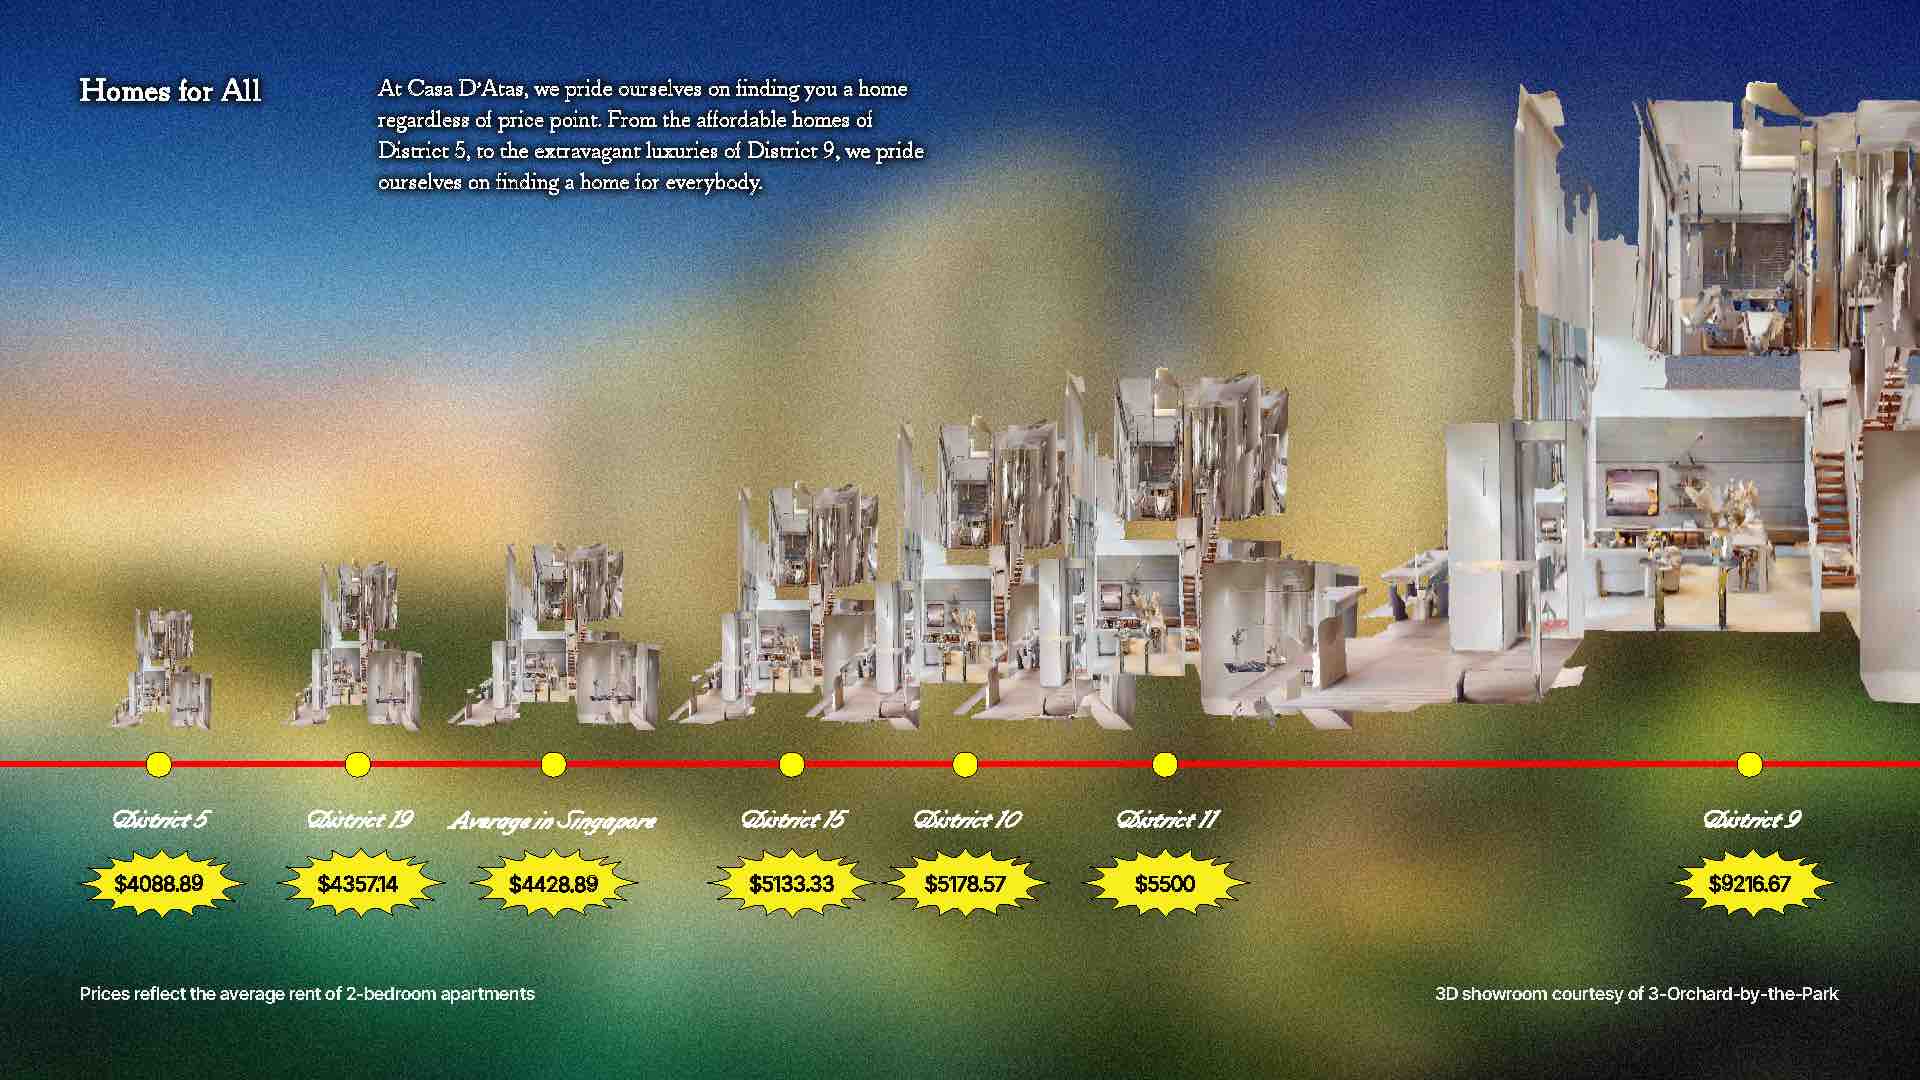
This was also our platform for creative data visualisation.
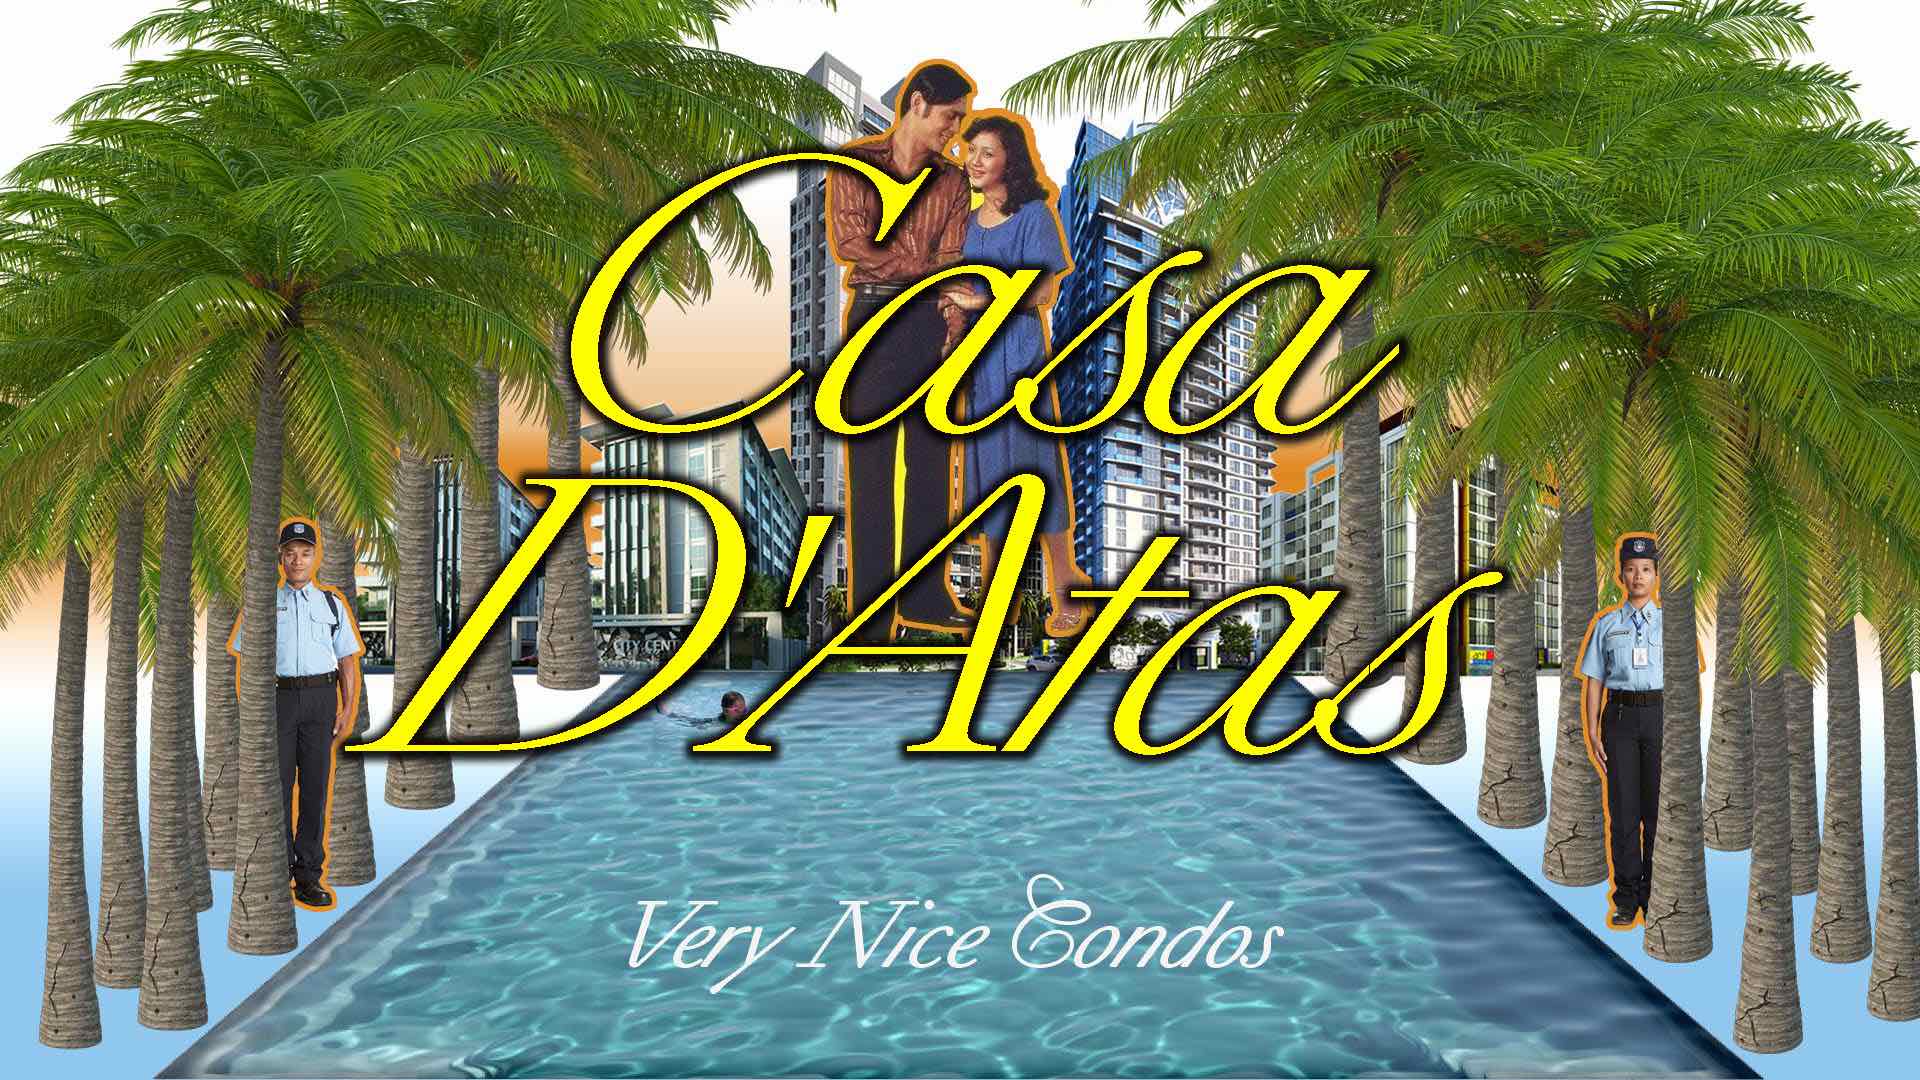
This brochure definitely started off pretty rough, as we were finding it difficult to think of creatives ways to present the data.
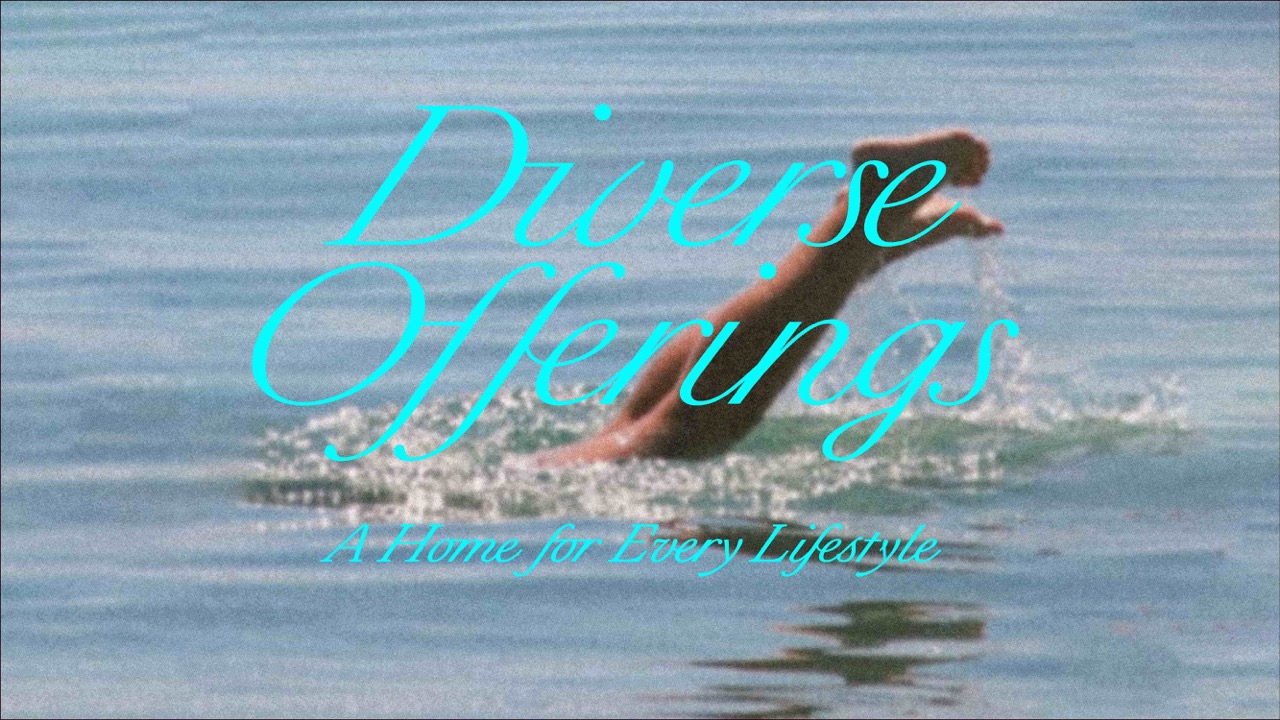
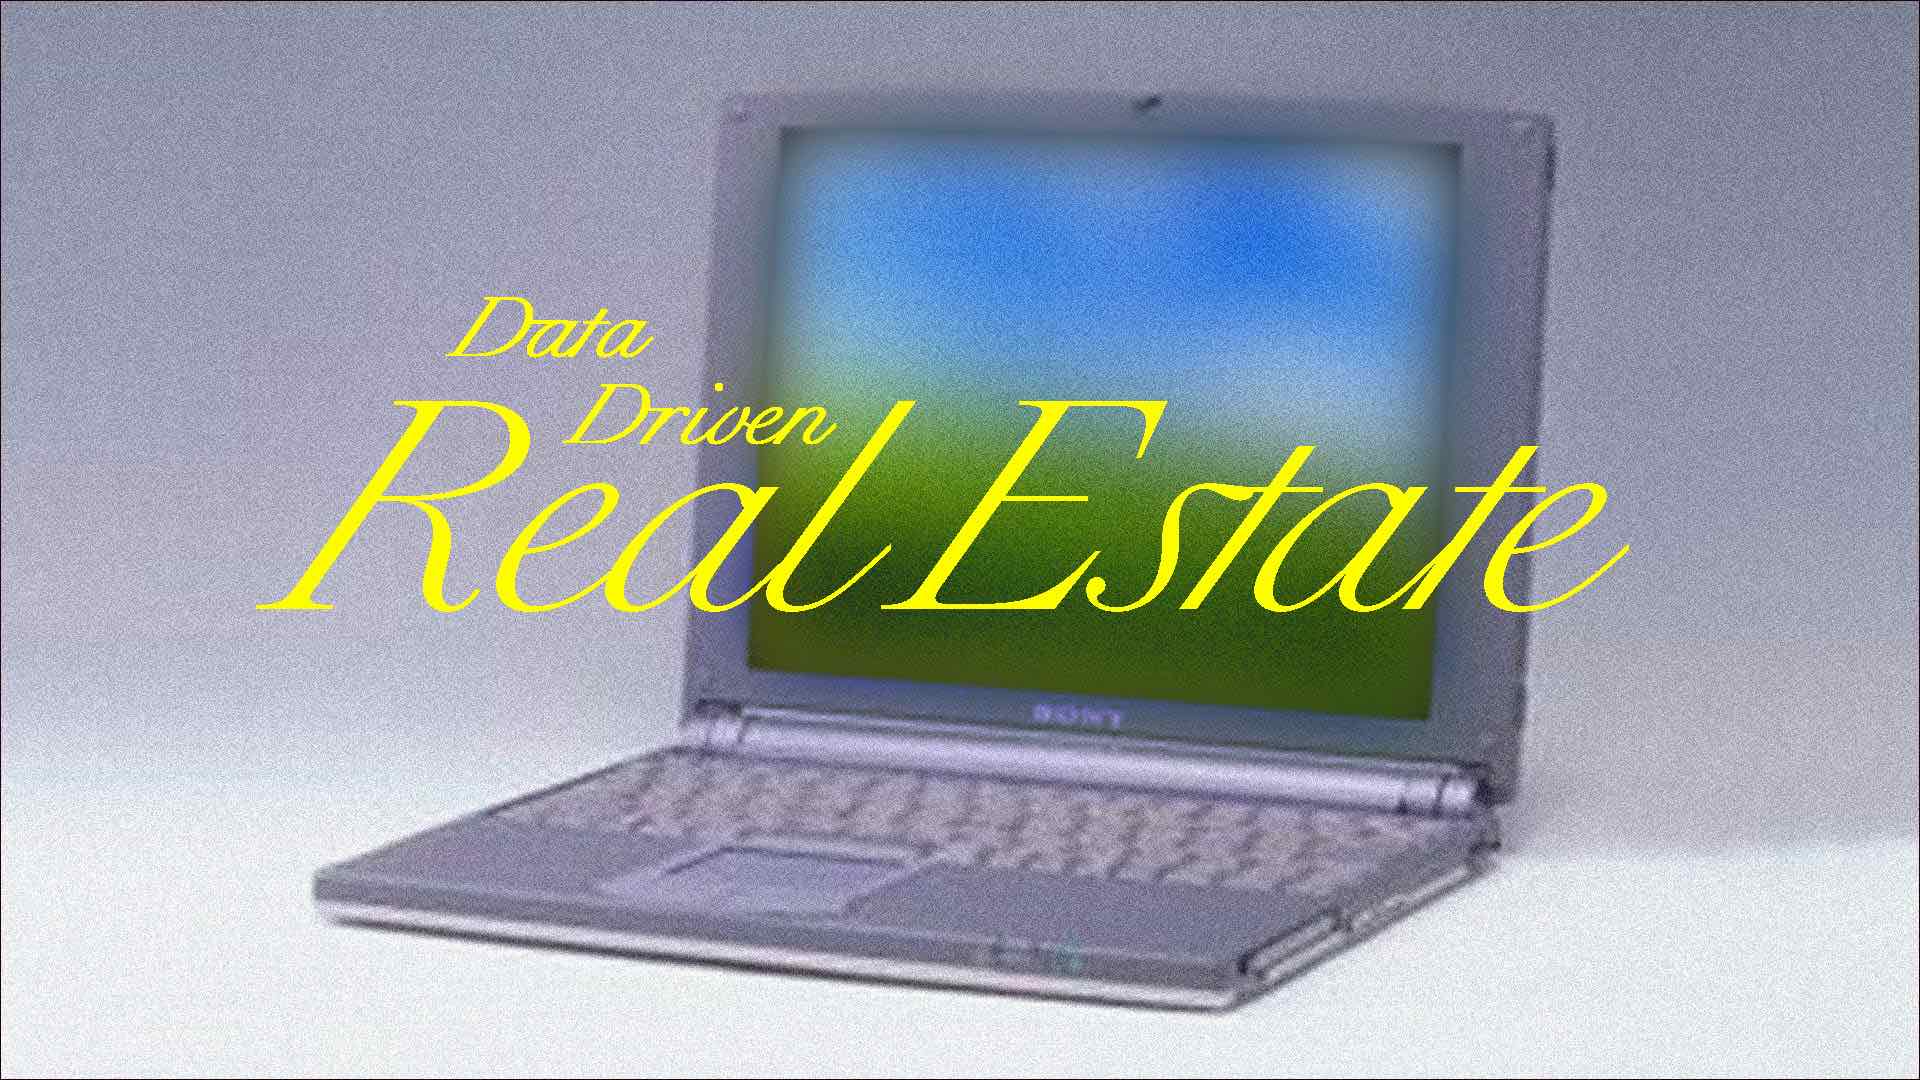
As we went along designing, the creative direction started to become clearer, and clearer. As mentioned before, we started taking inspiration from hopeful aesthetics from early internet days, old Singaporean ads, and stock maximalism.
The picture eventually became clearer and clearer.

Hopeful Aesthetics
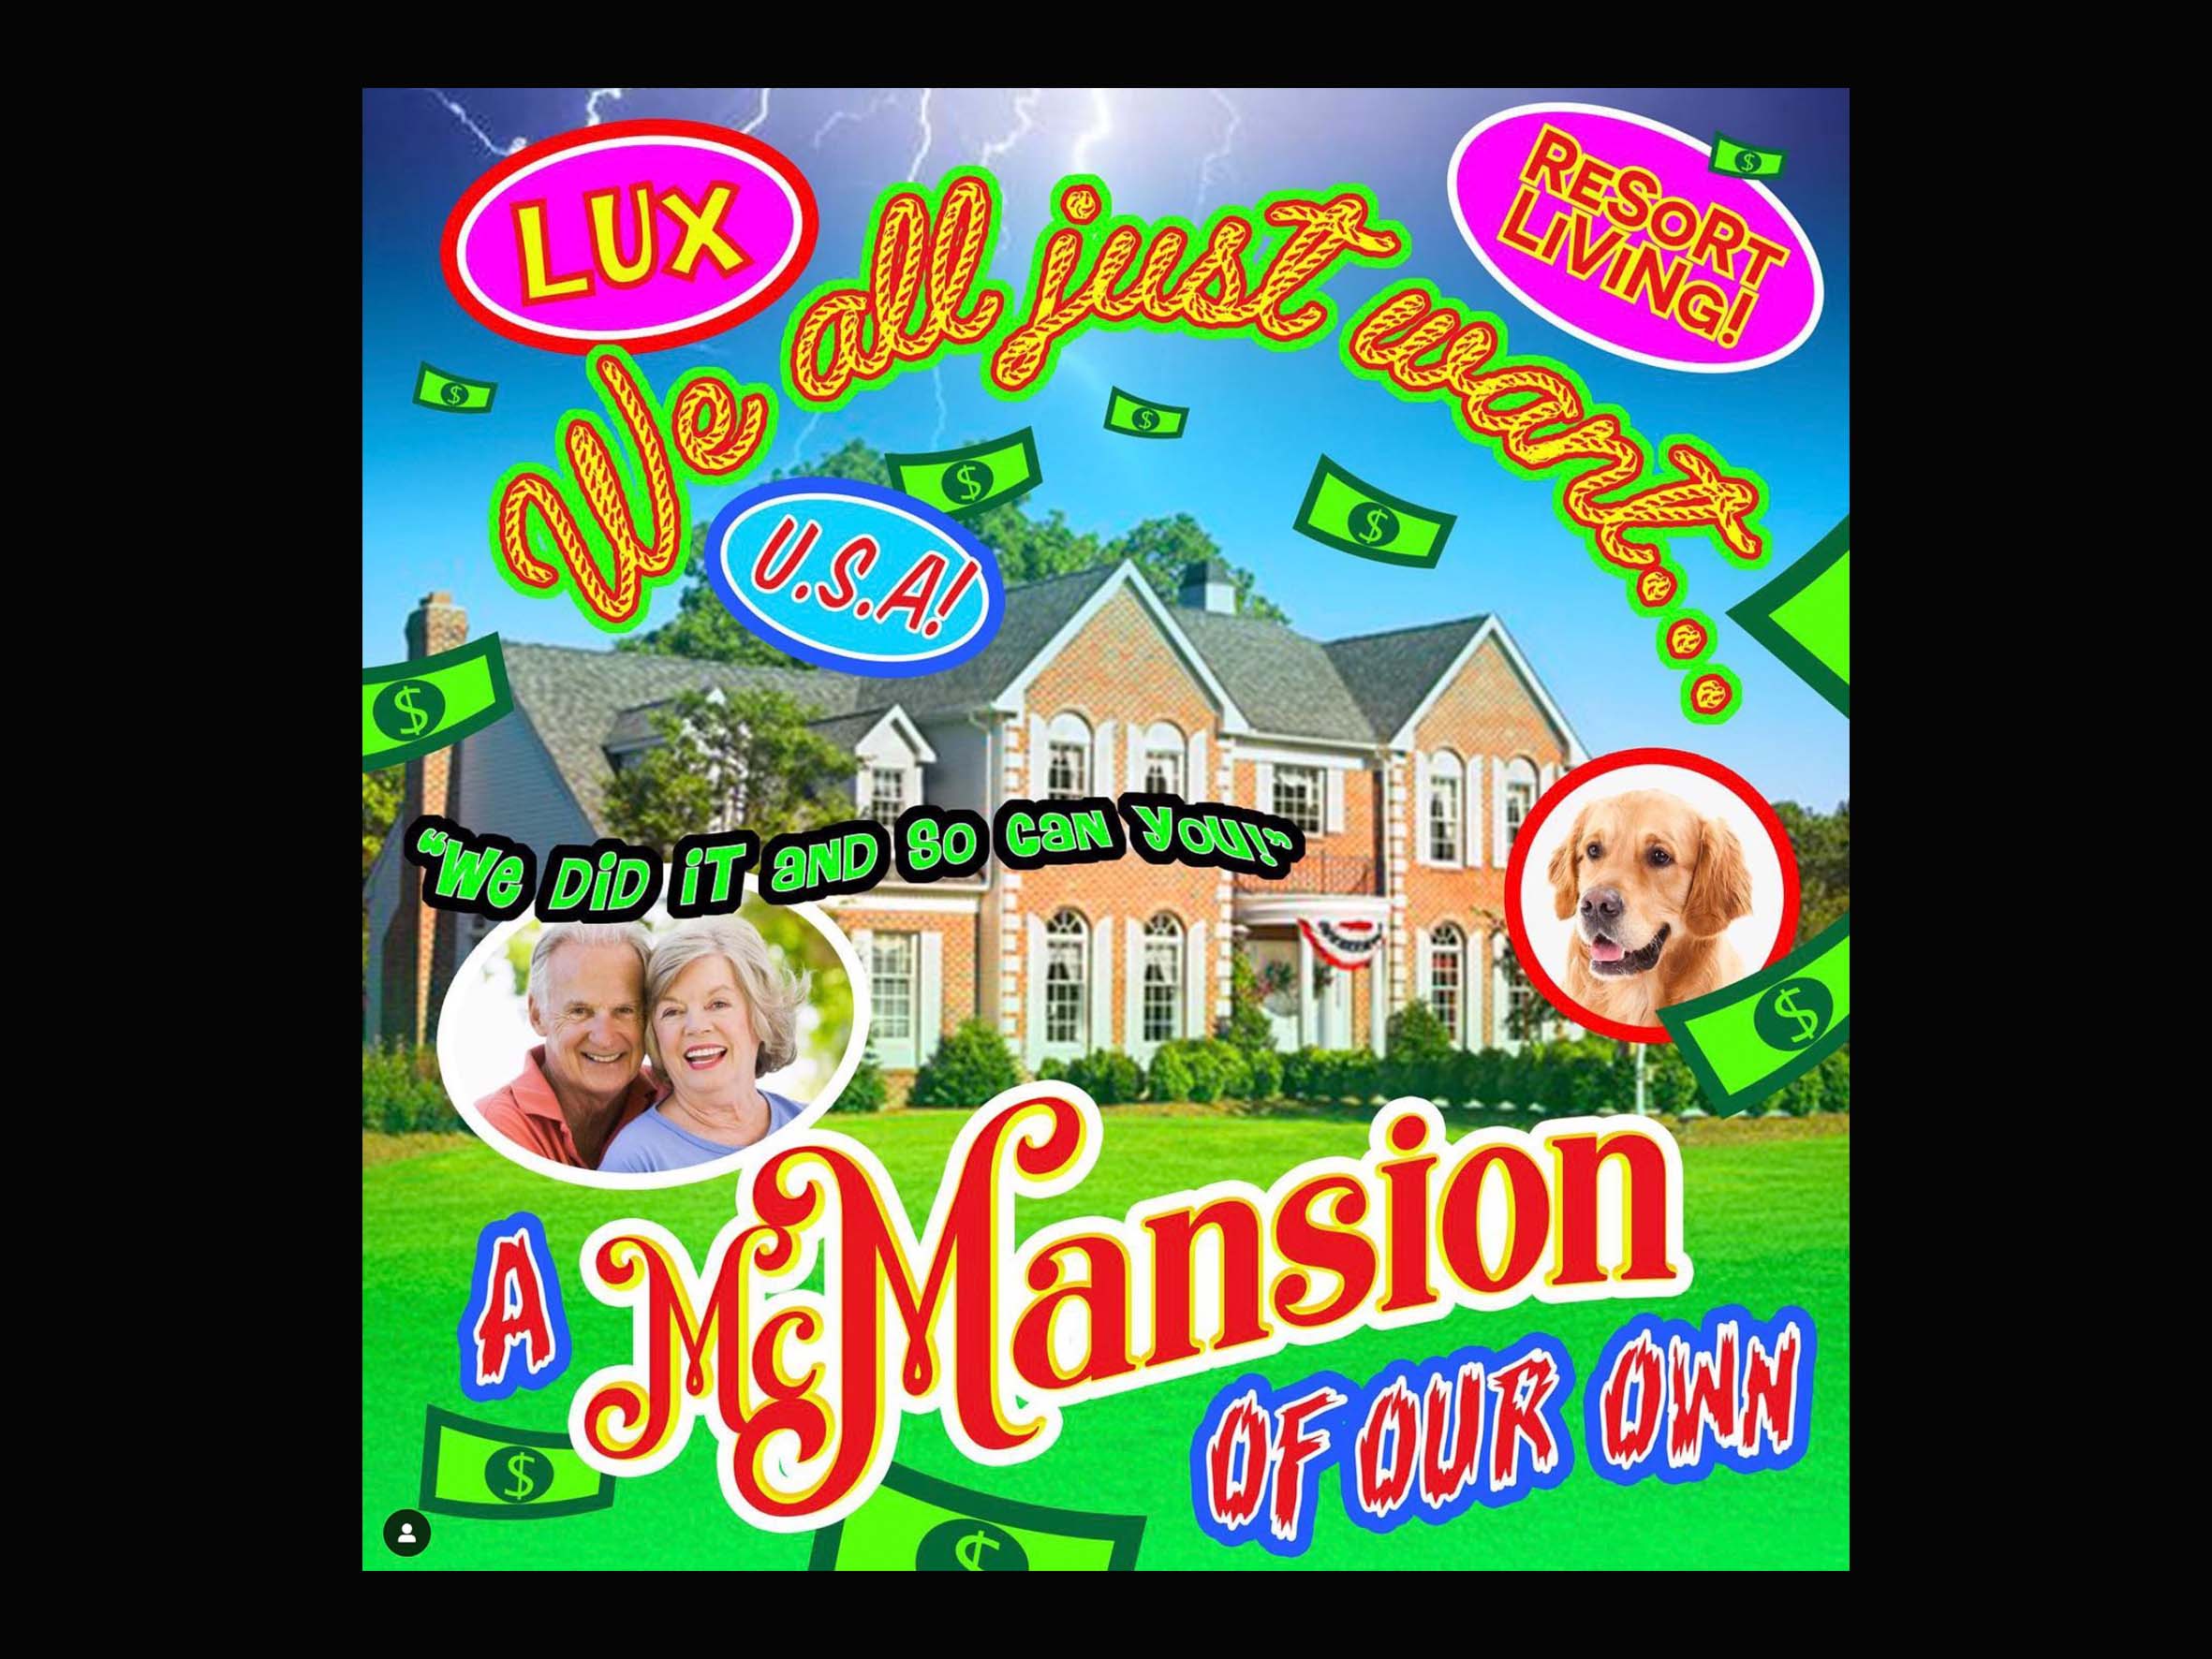
Stock Maximalism
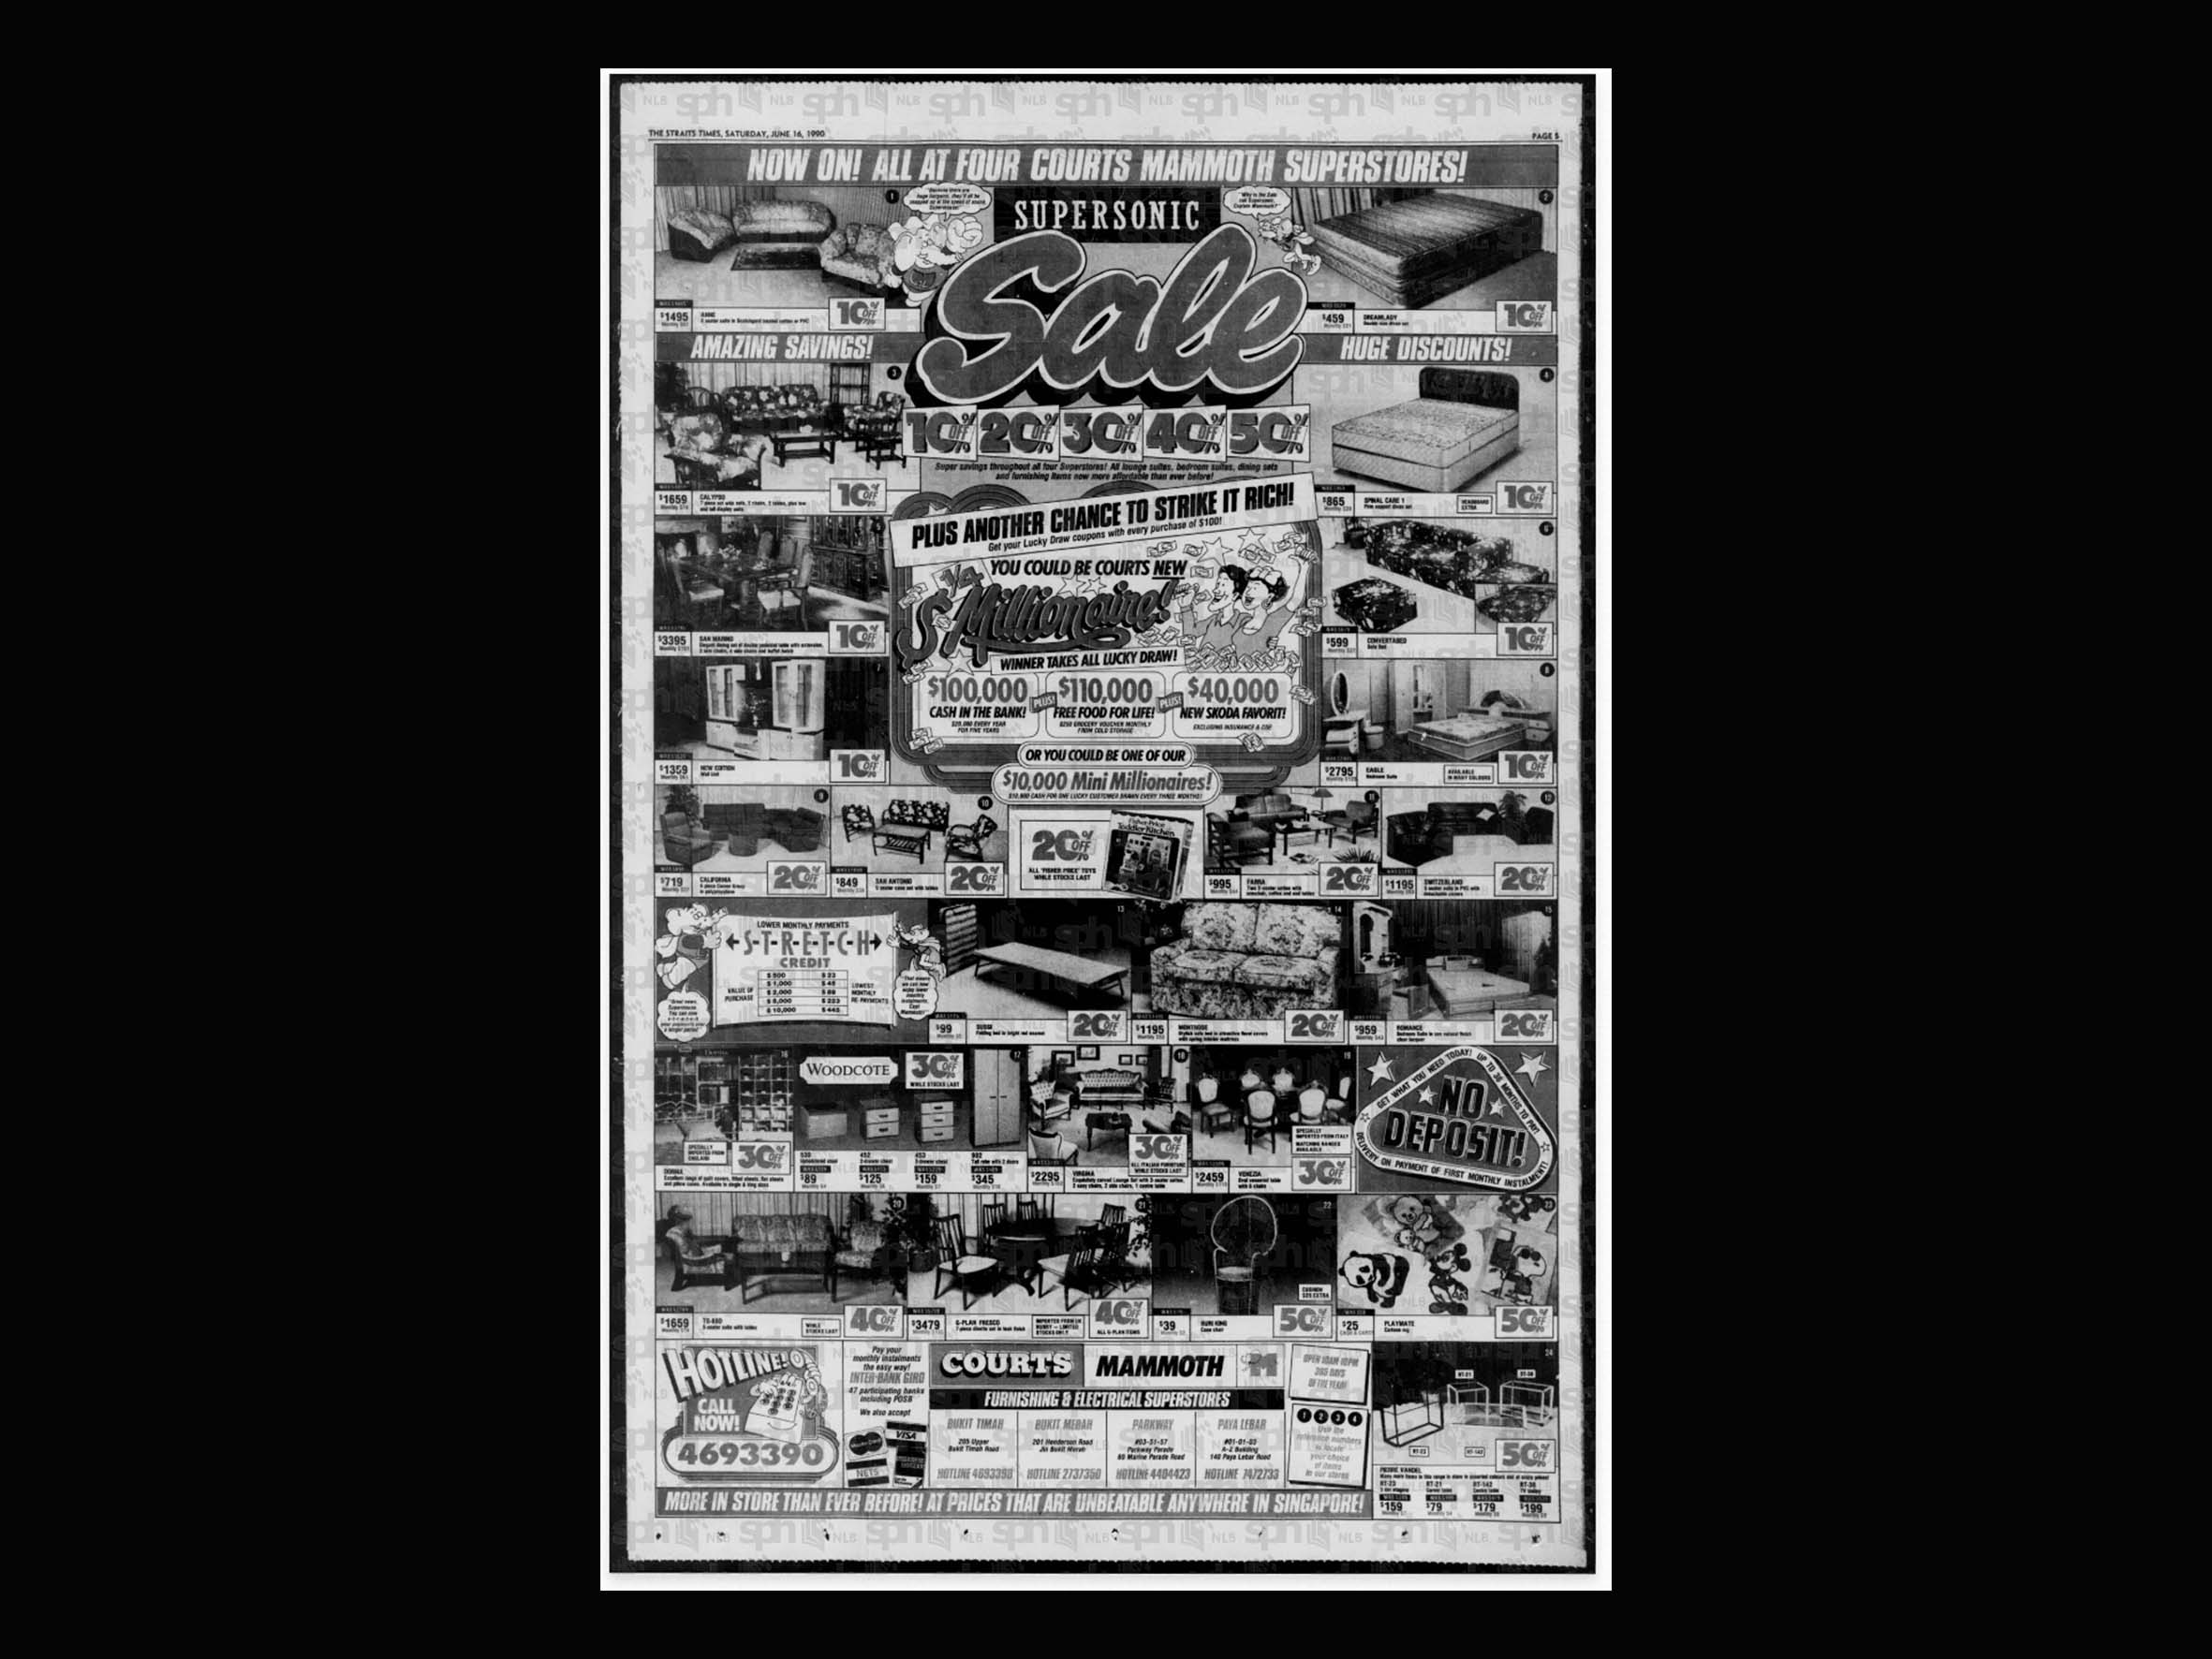
Old Singaporean Ads

3. Video
The video was a fun addition that helped to set the tone for the absurdity of the whole project.
This was also another challenge in applying humour across not just static visuals, but in video form. This came with considering things like movement, editing cuts, sound, transitions.
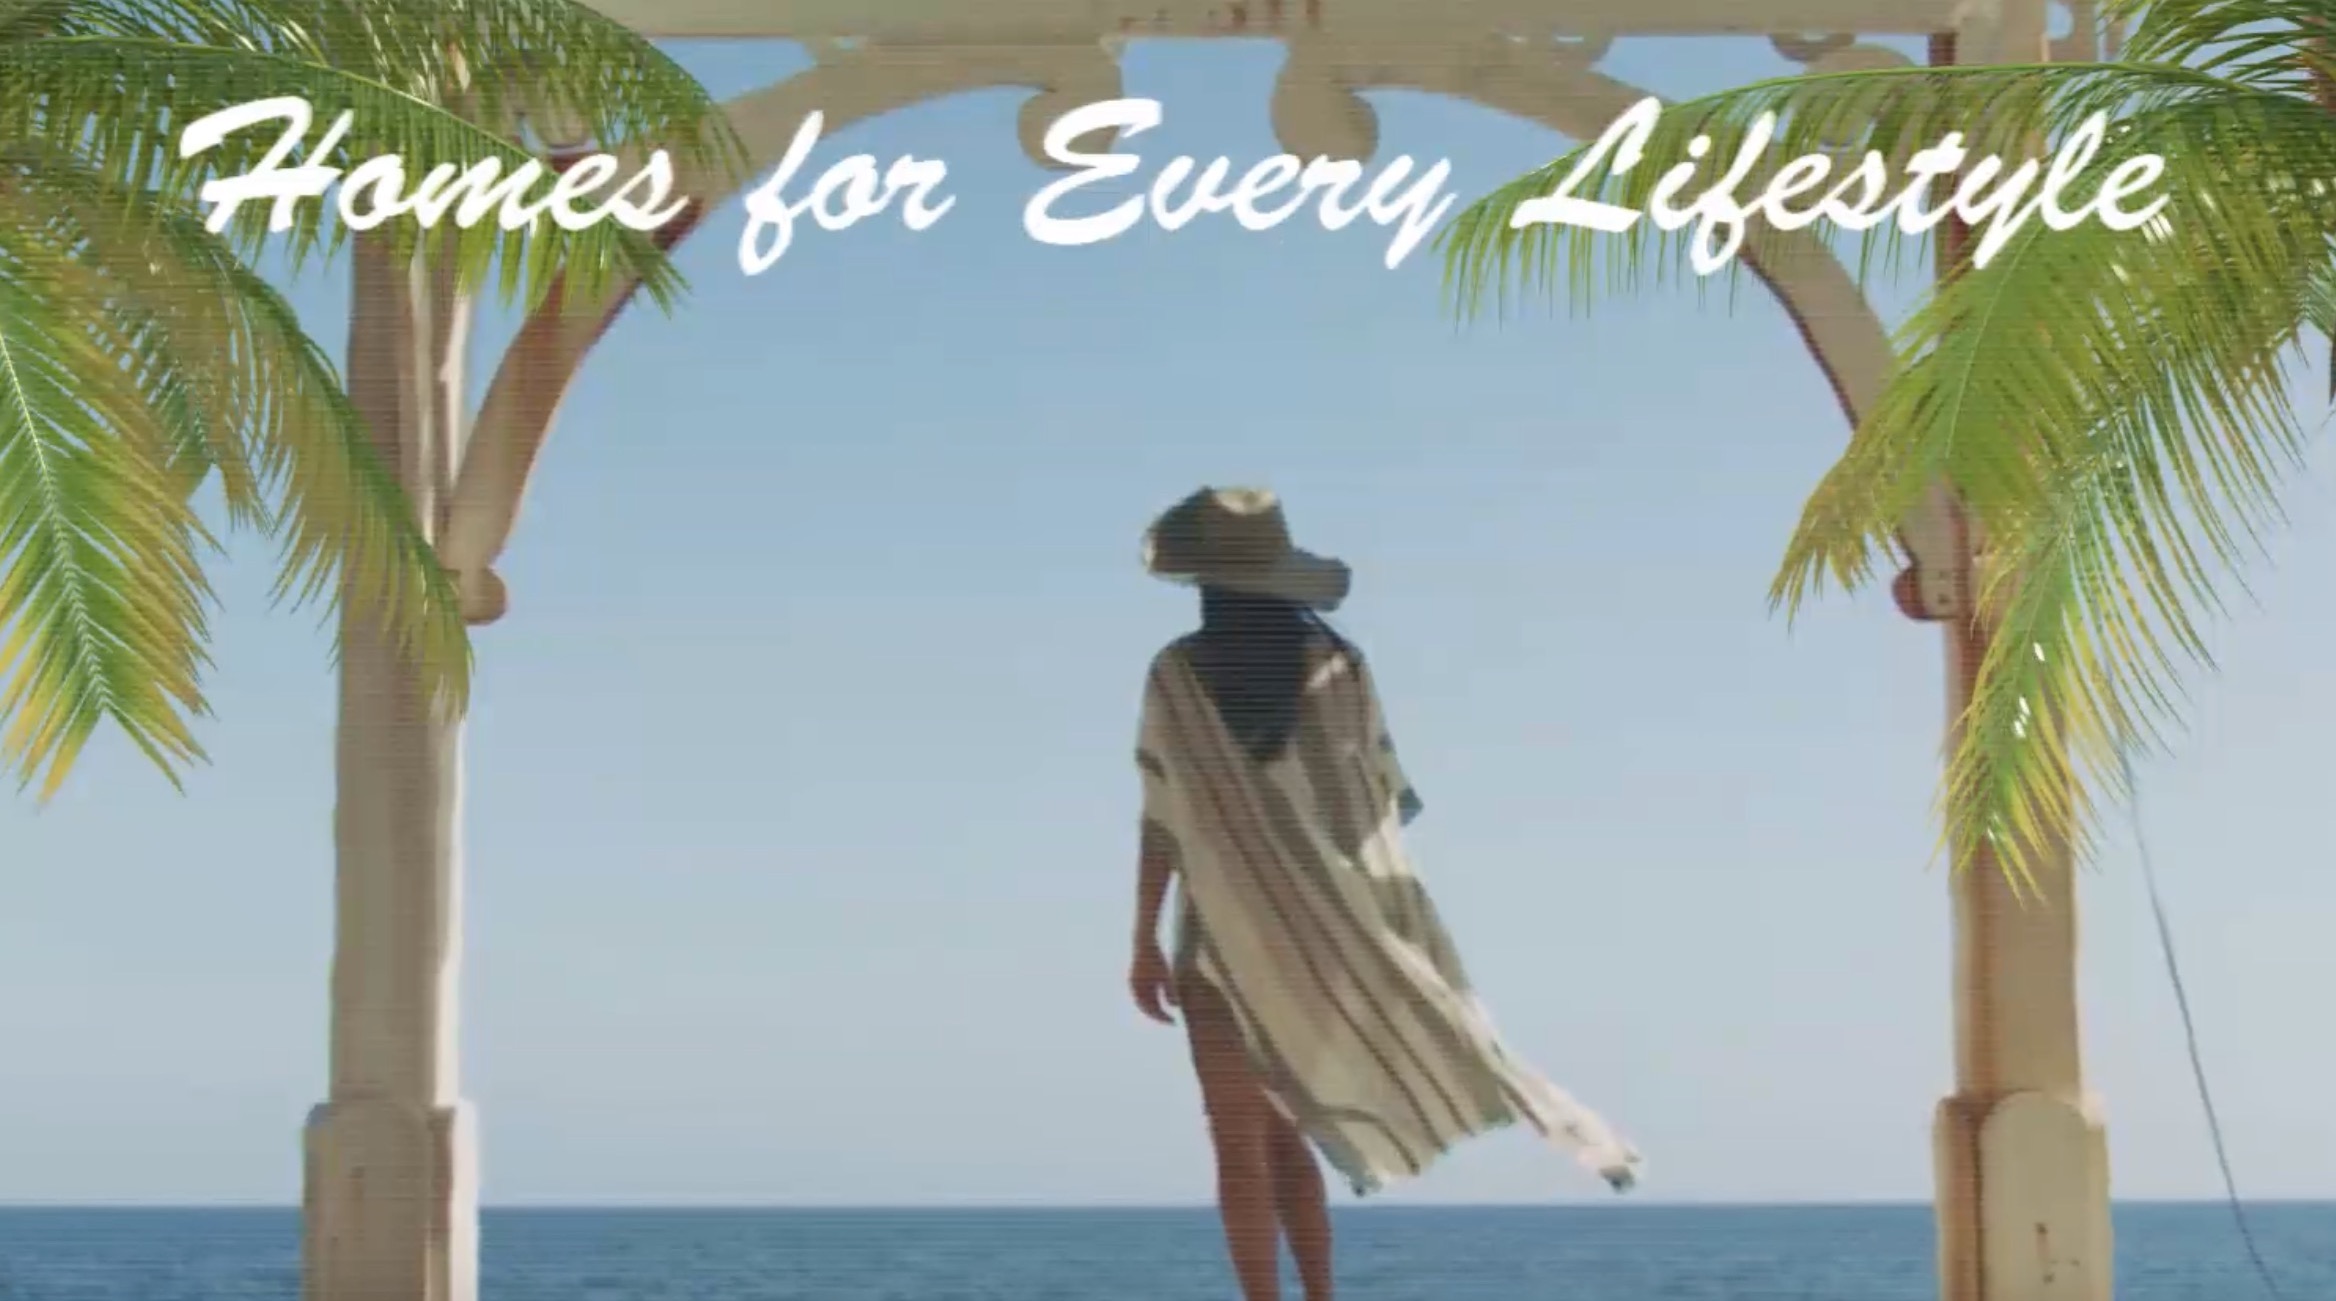
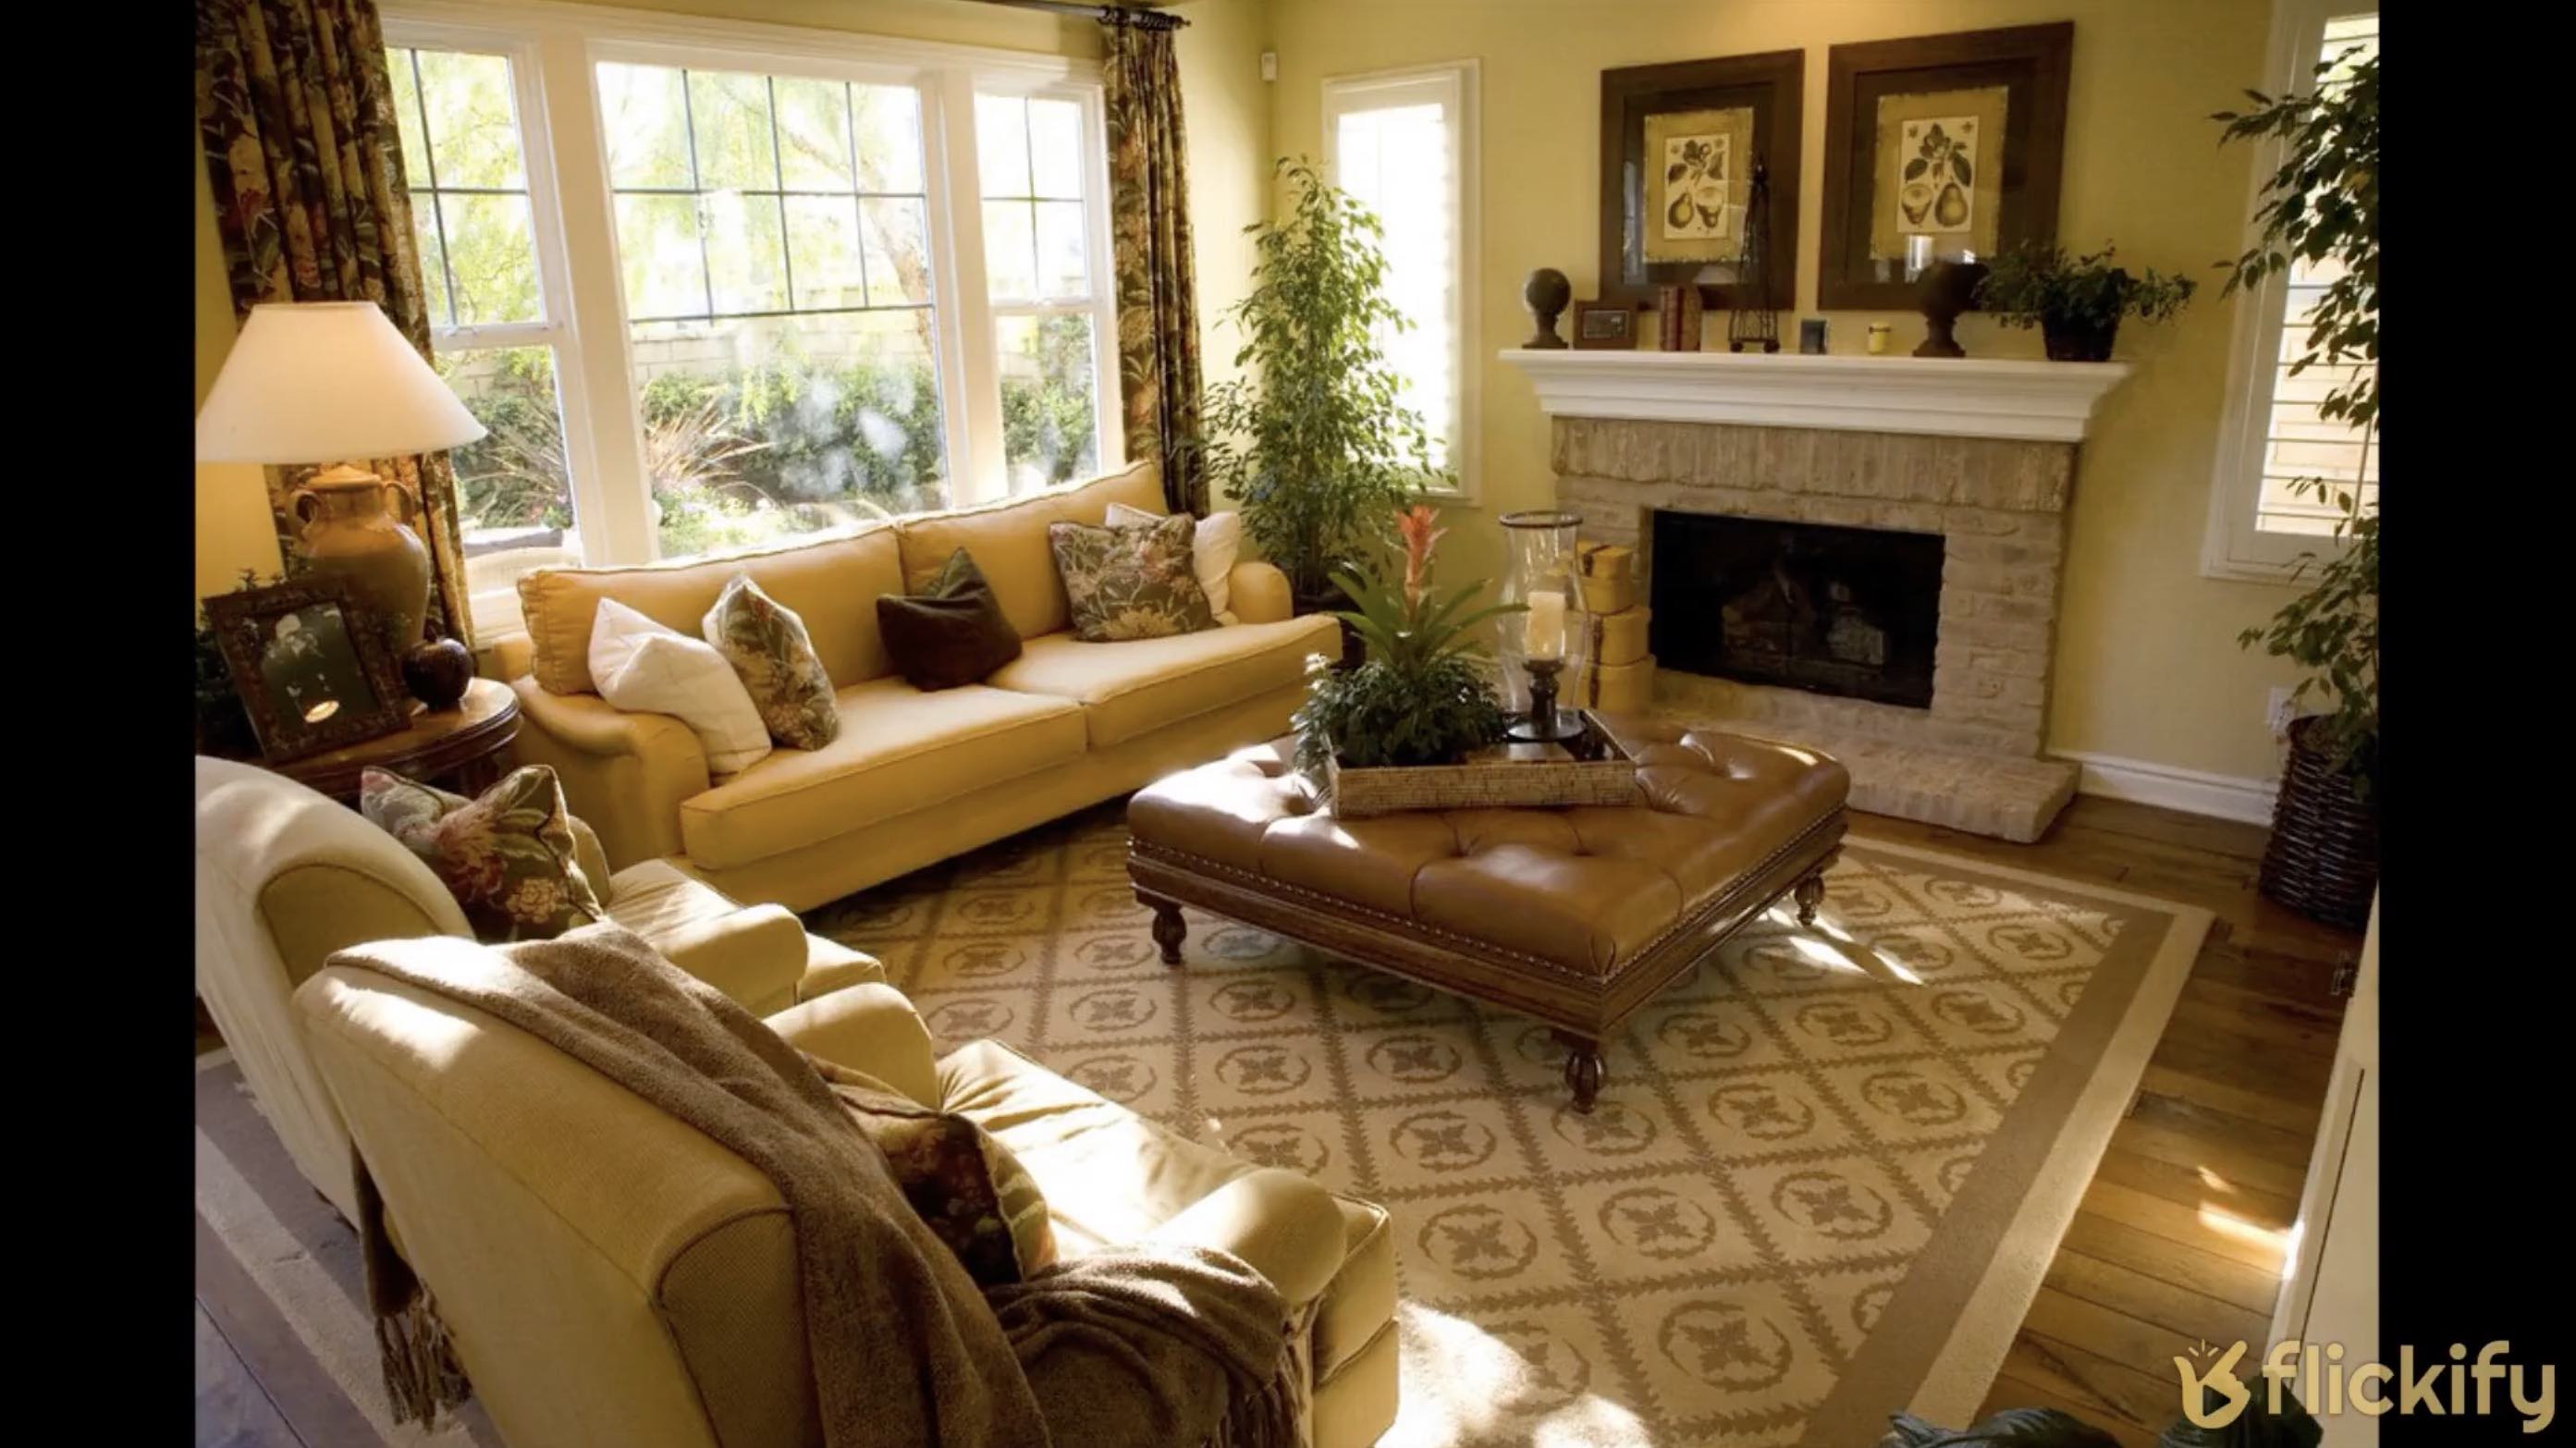
Our first attempt at creating a video was to experiment with AI. We were curious about how AI would've intepret certain prompts like "Singaporean Condo", "Luxury Condo", etc.
We wrote a script and input it into Flickify, a software that would select images off the internet based on the provided script and generate a video.
We thought the video was hilarious, but eventually scrapped the idea as we felt our use of AI would not add much value to the project if we didn't flesh it out enough. In the interest of time, we decided it would be quicker to create a video ourselves.
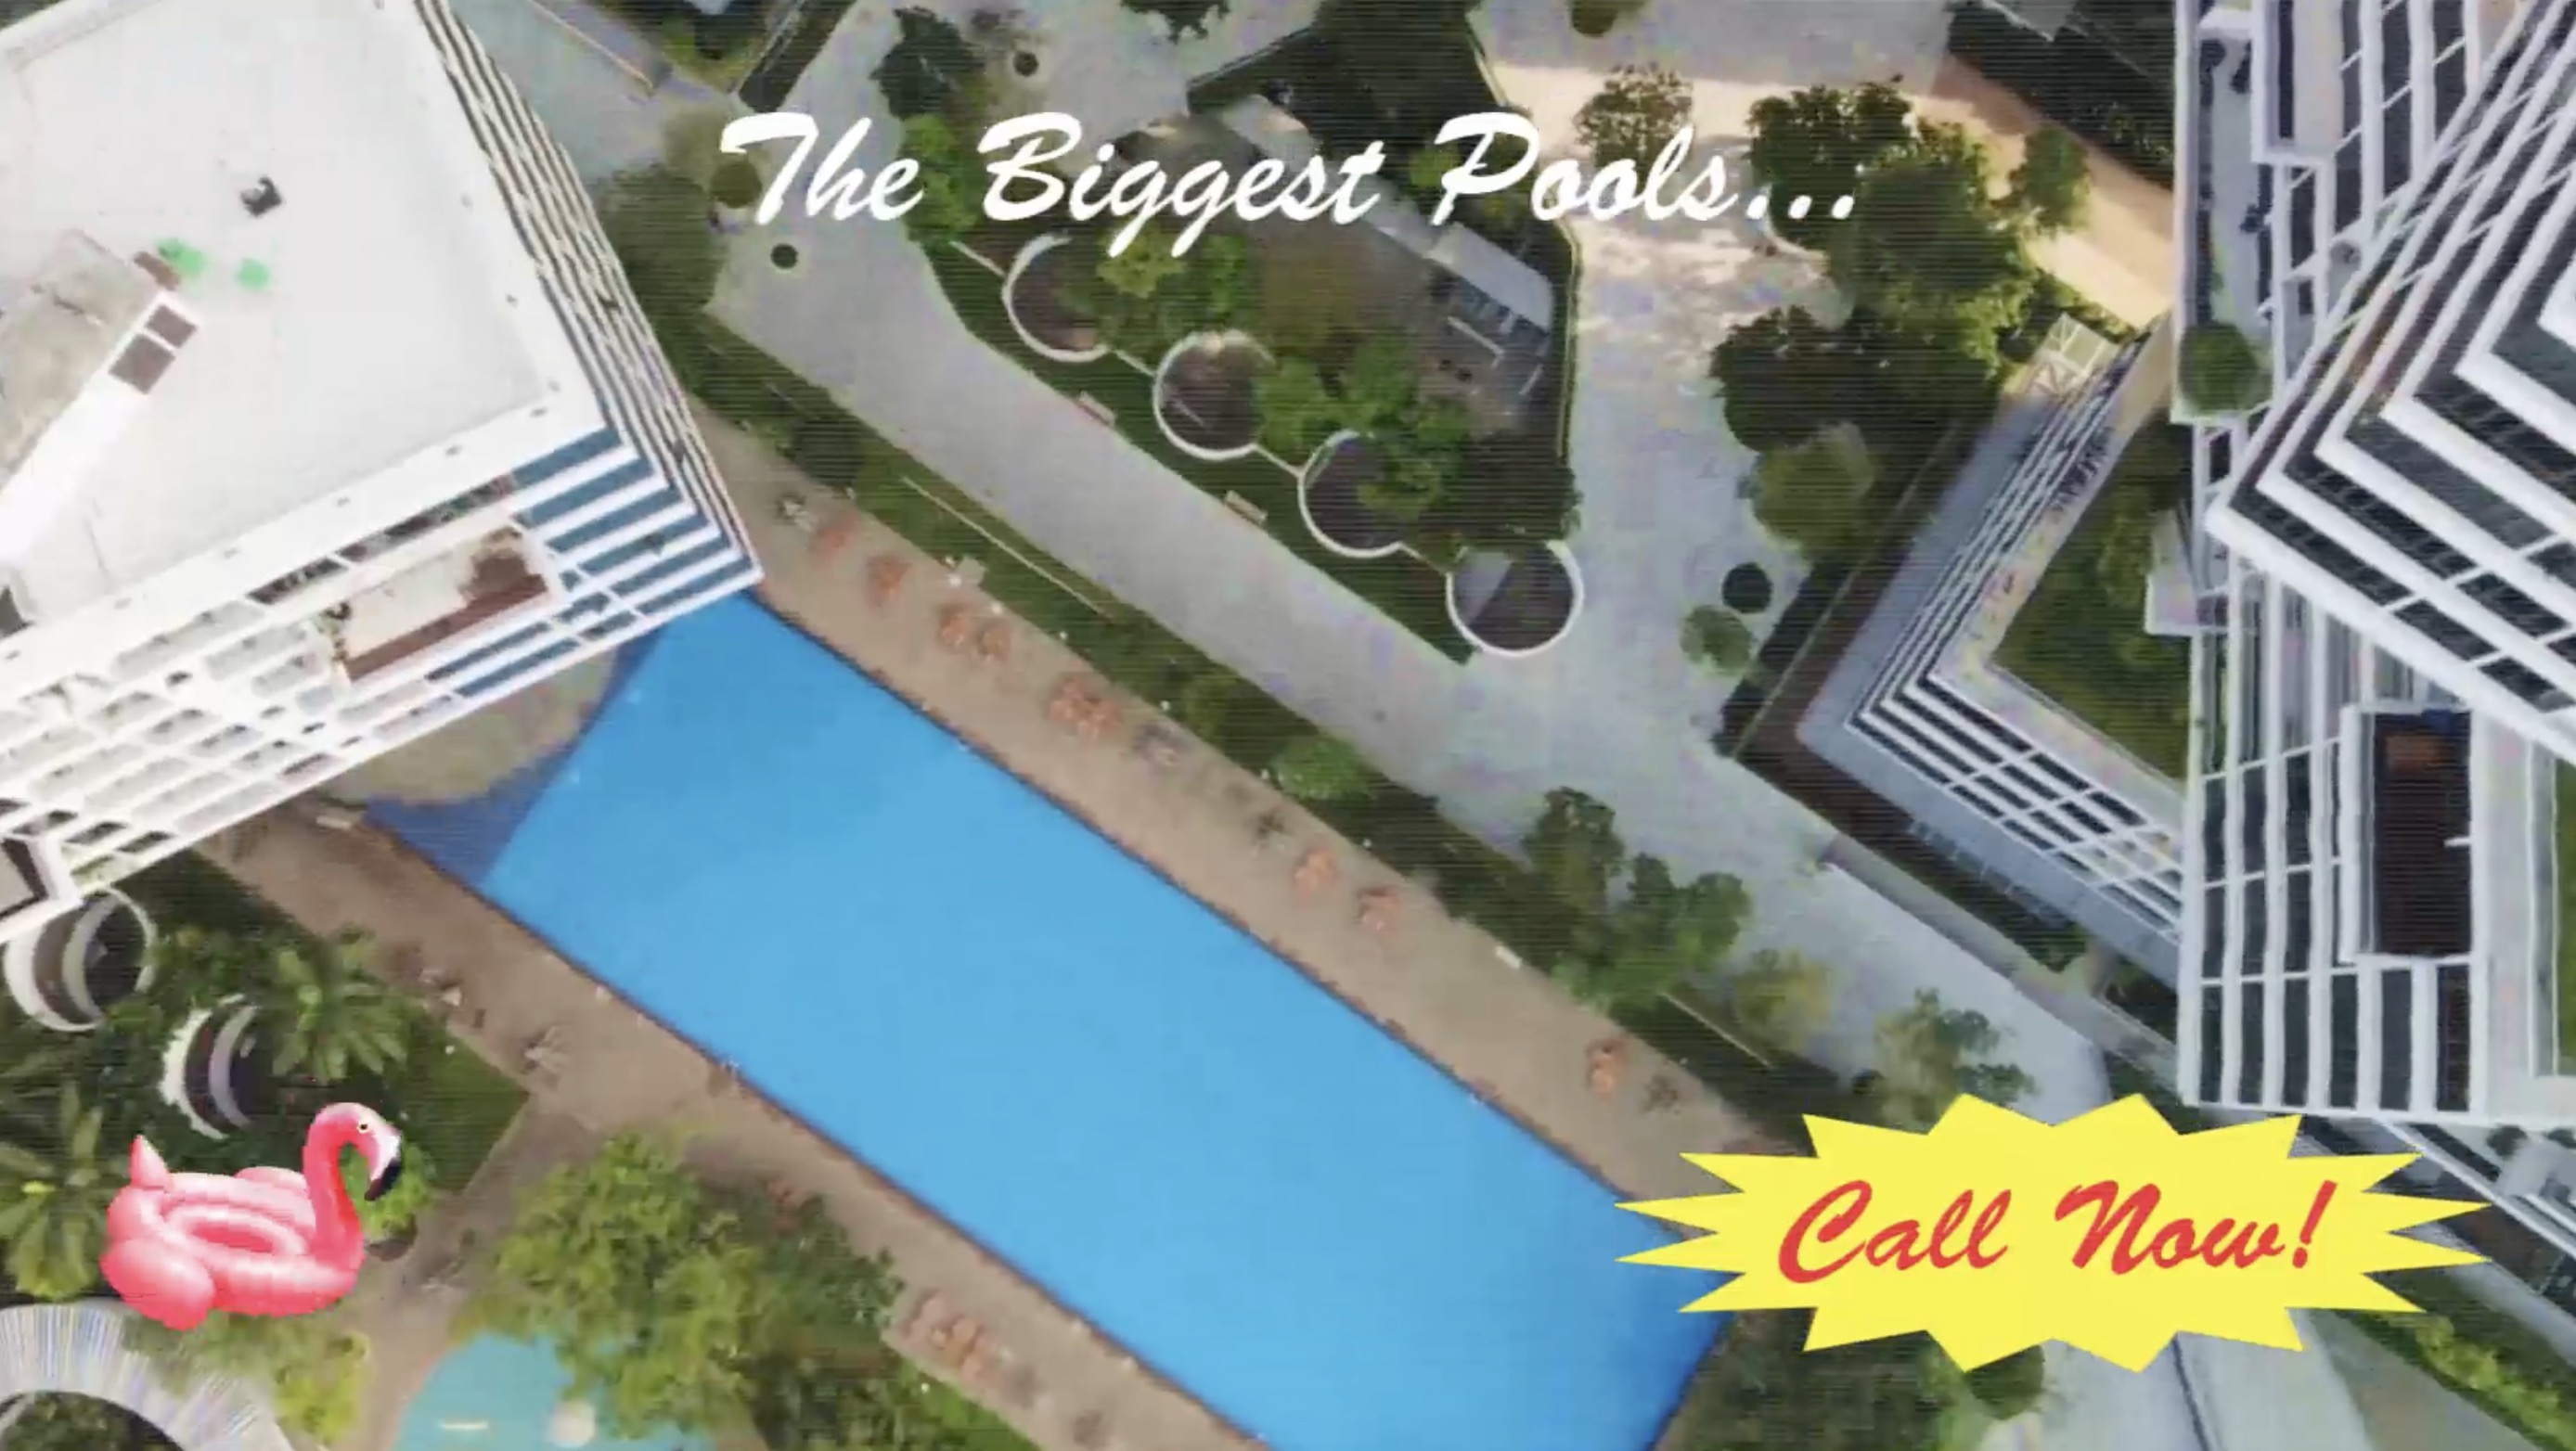
Enter... Cheesy Commercials.
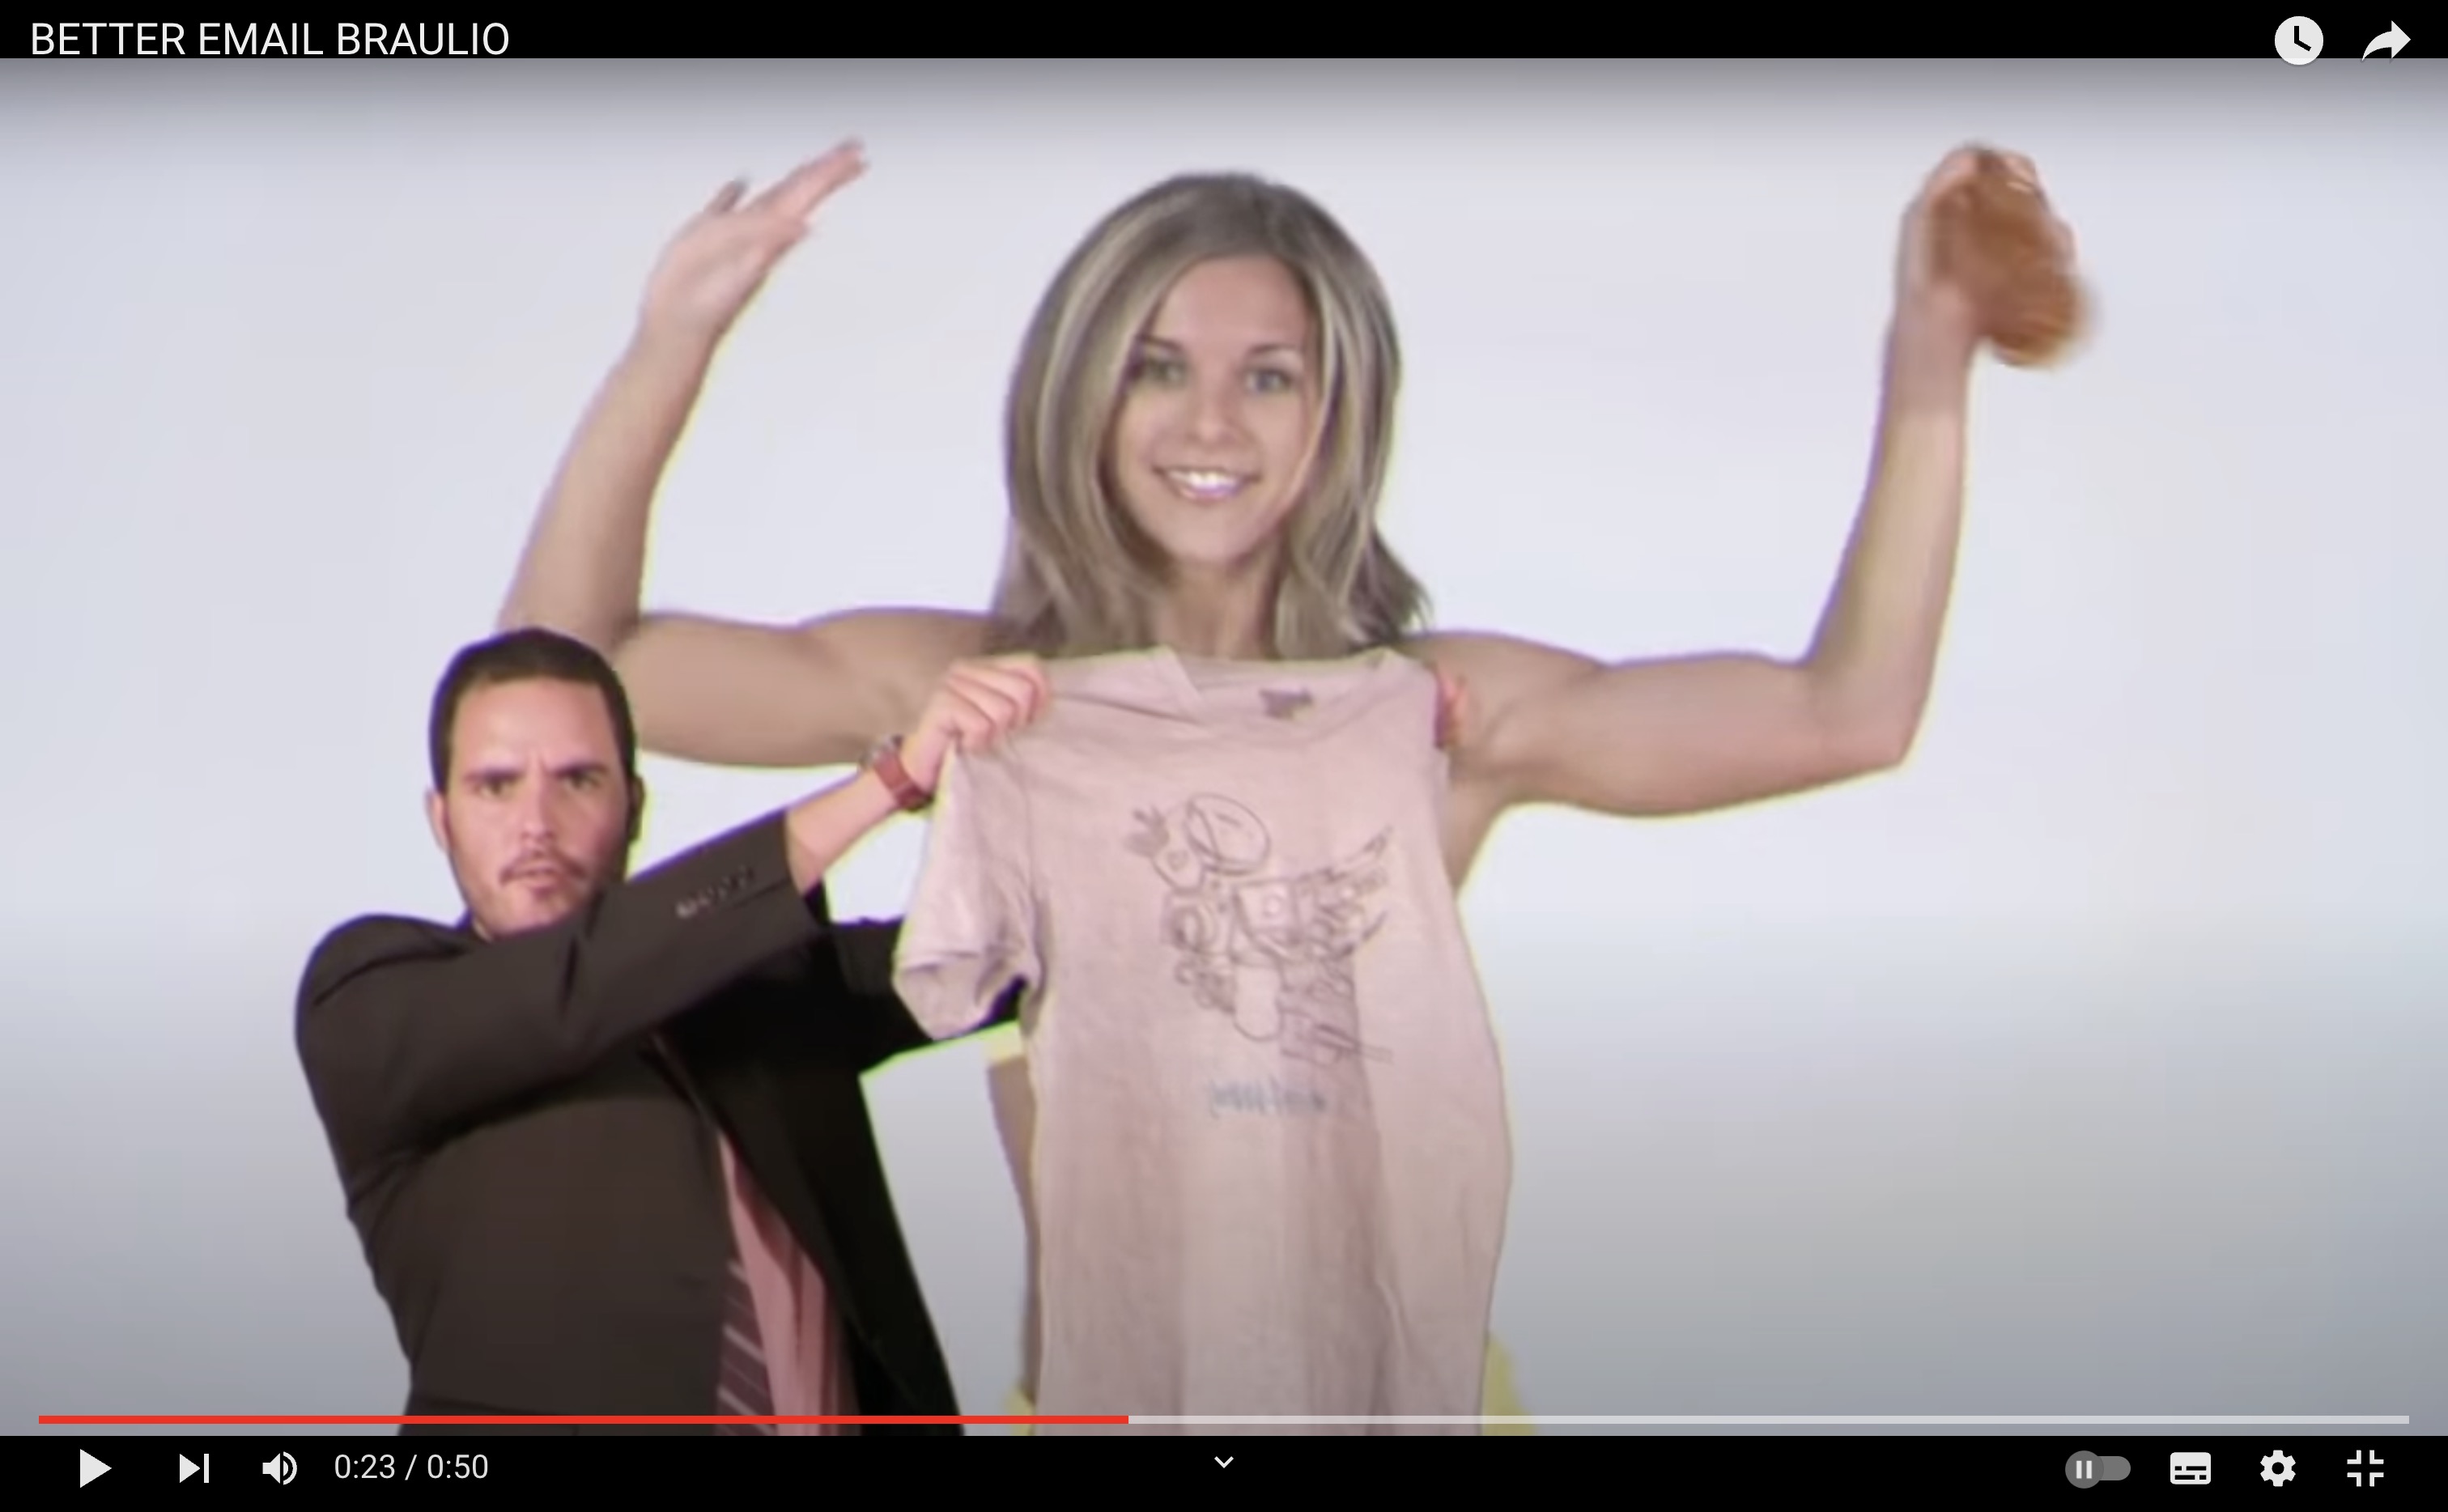
One of our favourite instance of this is in the TV show Breaking Bad.
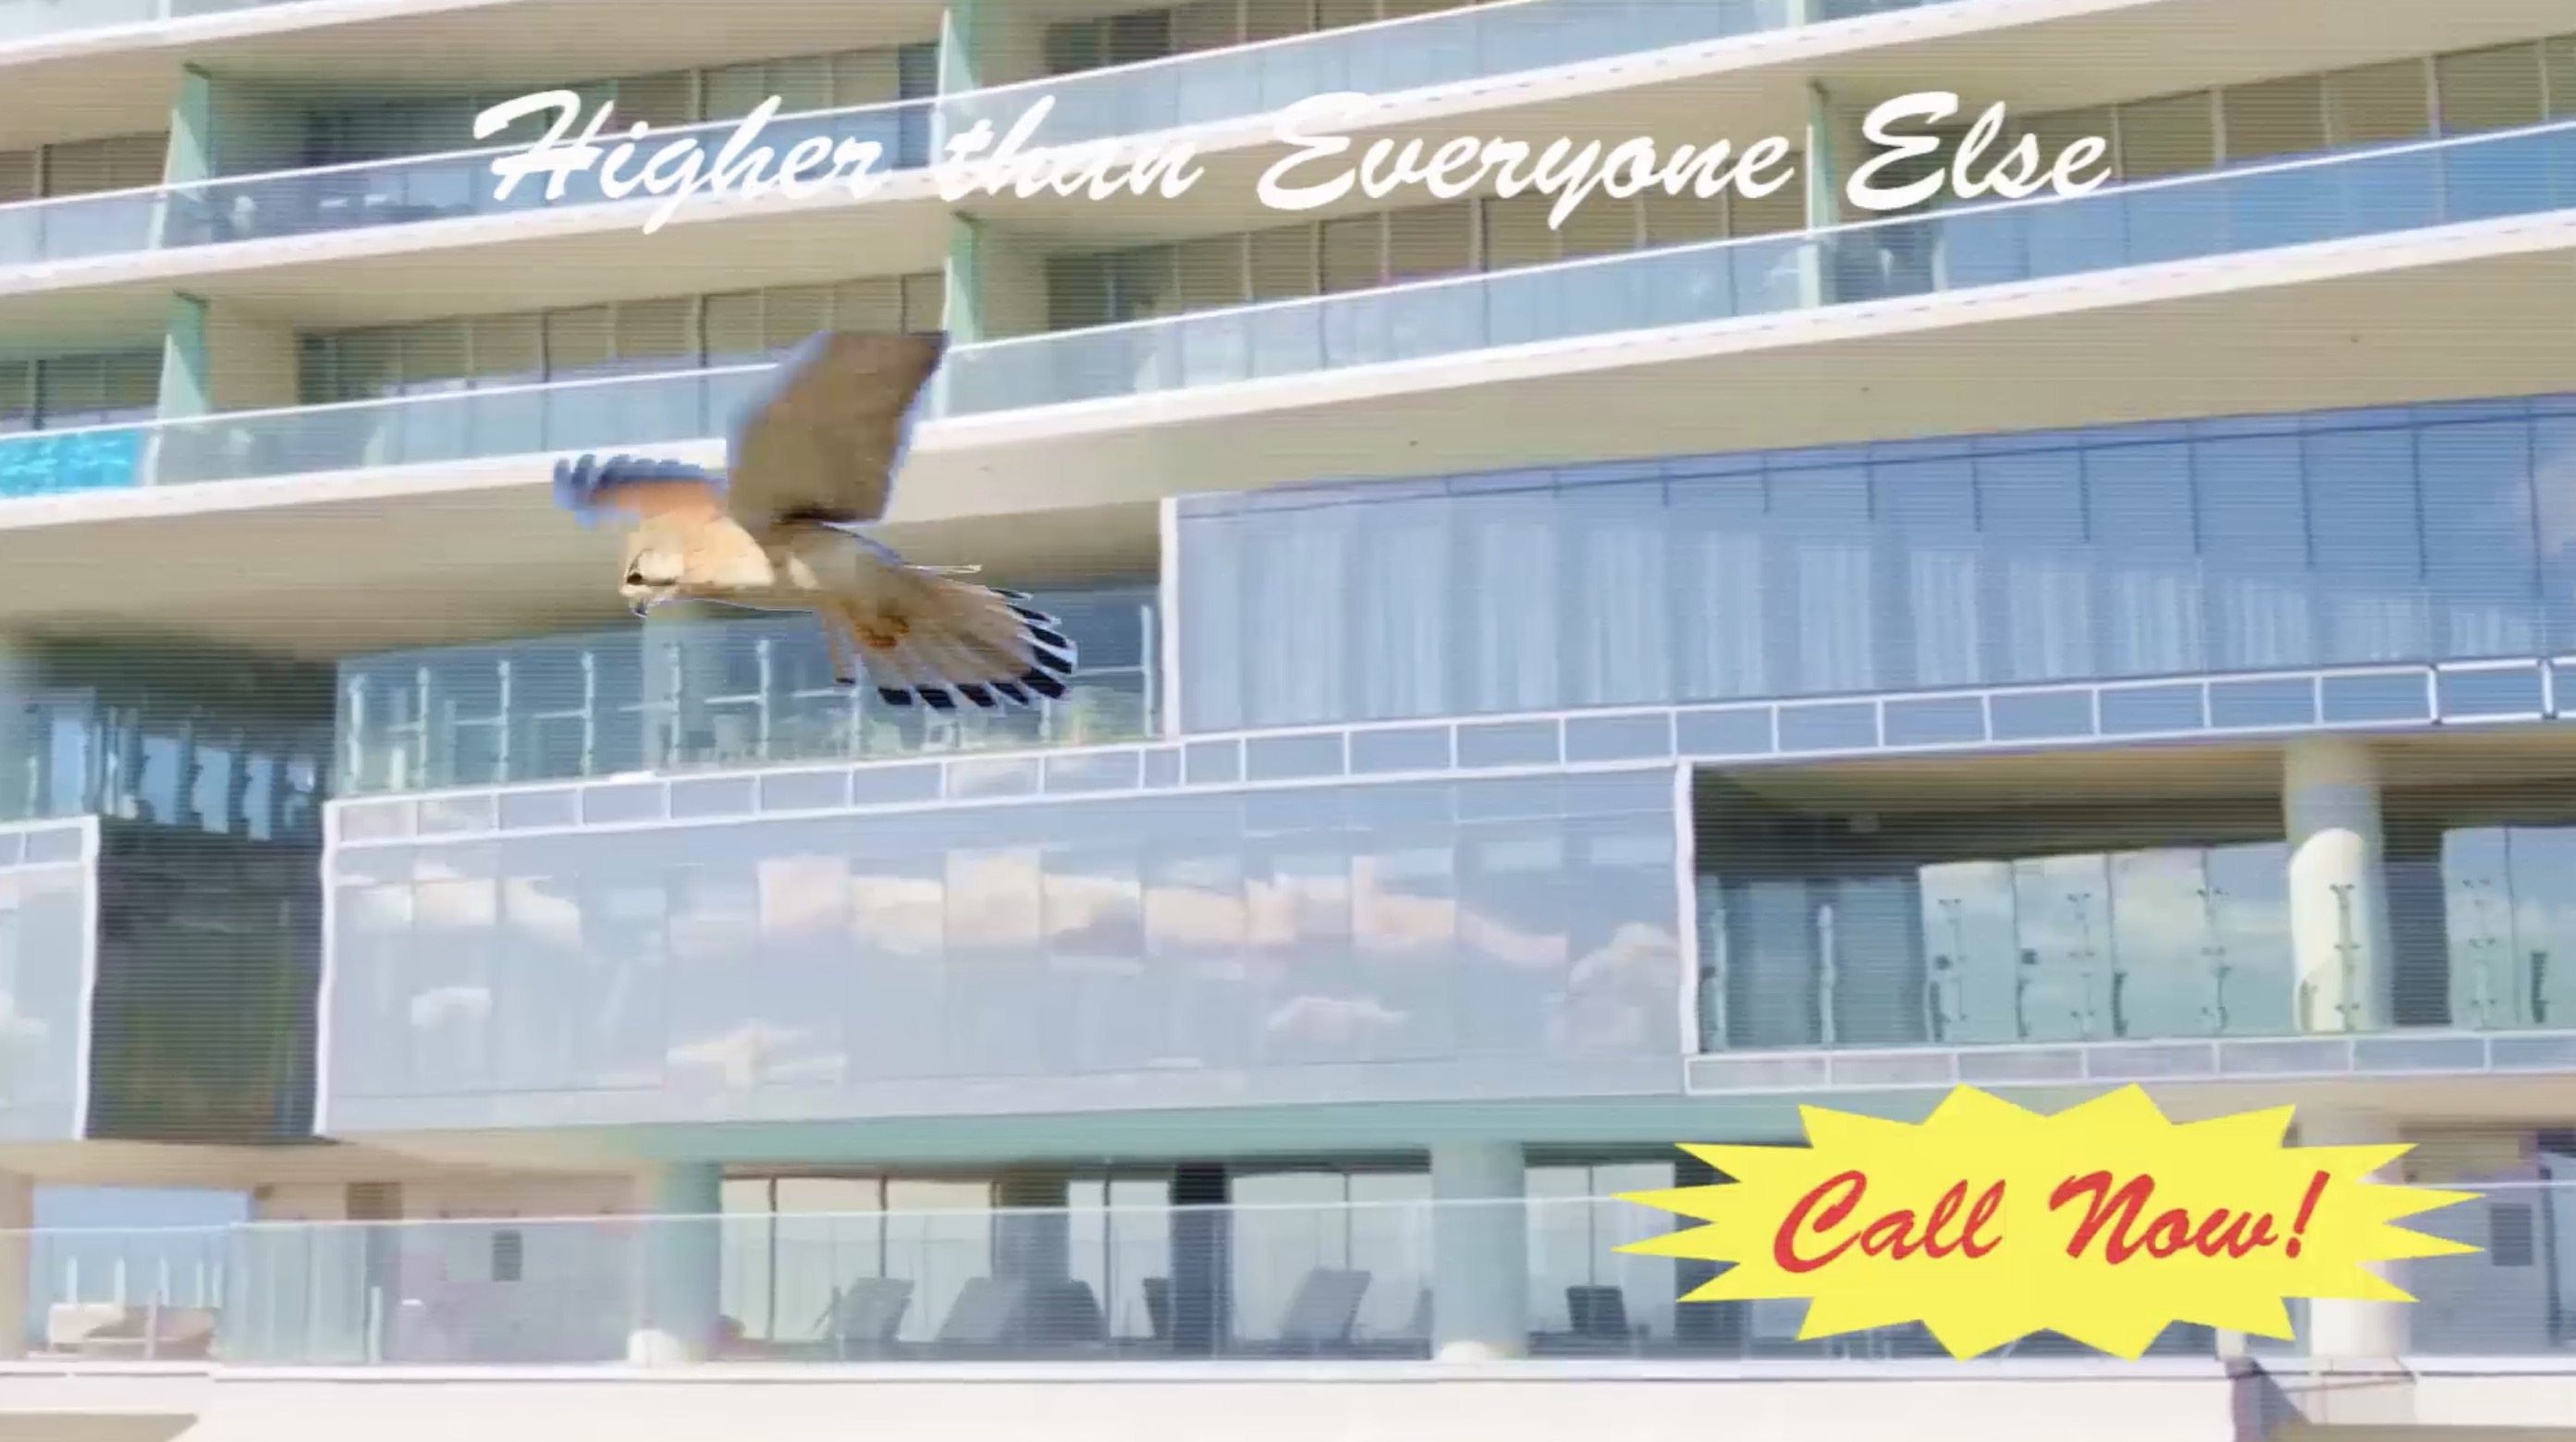
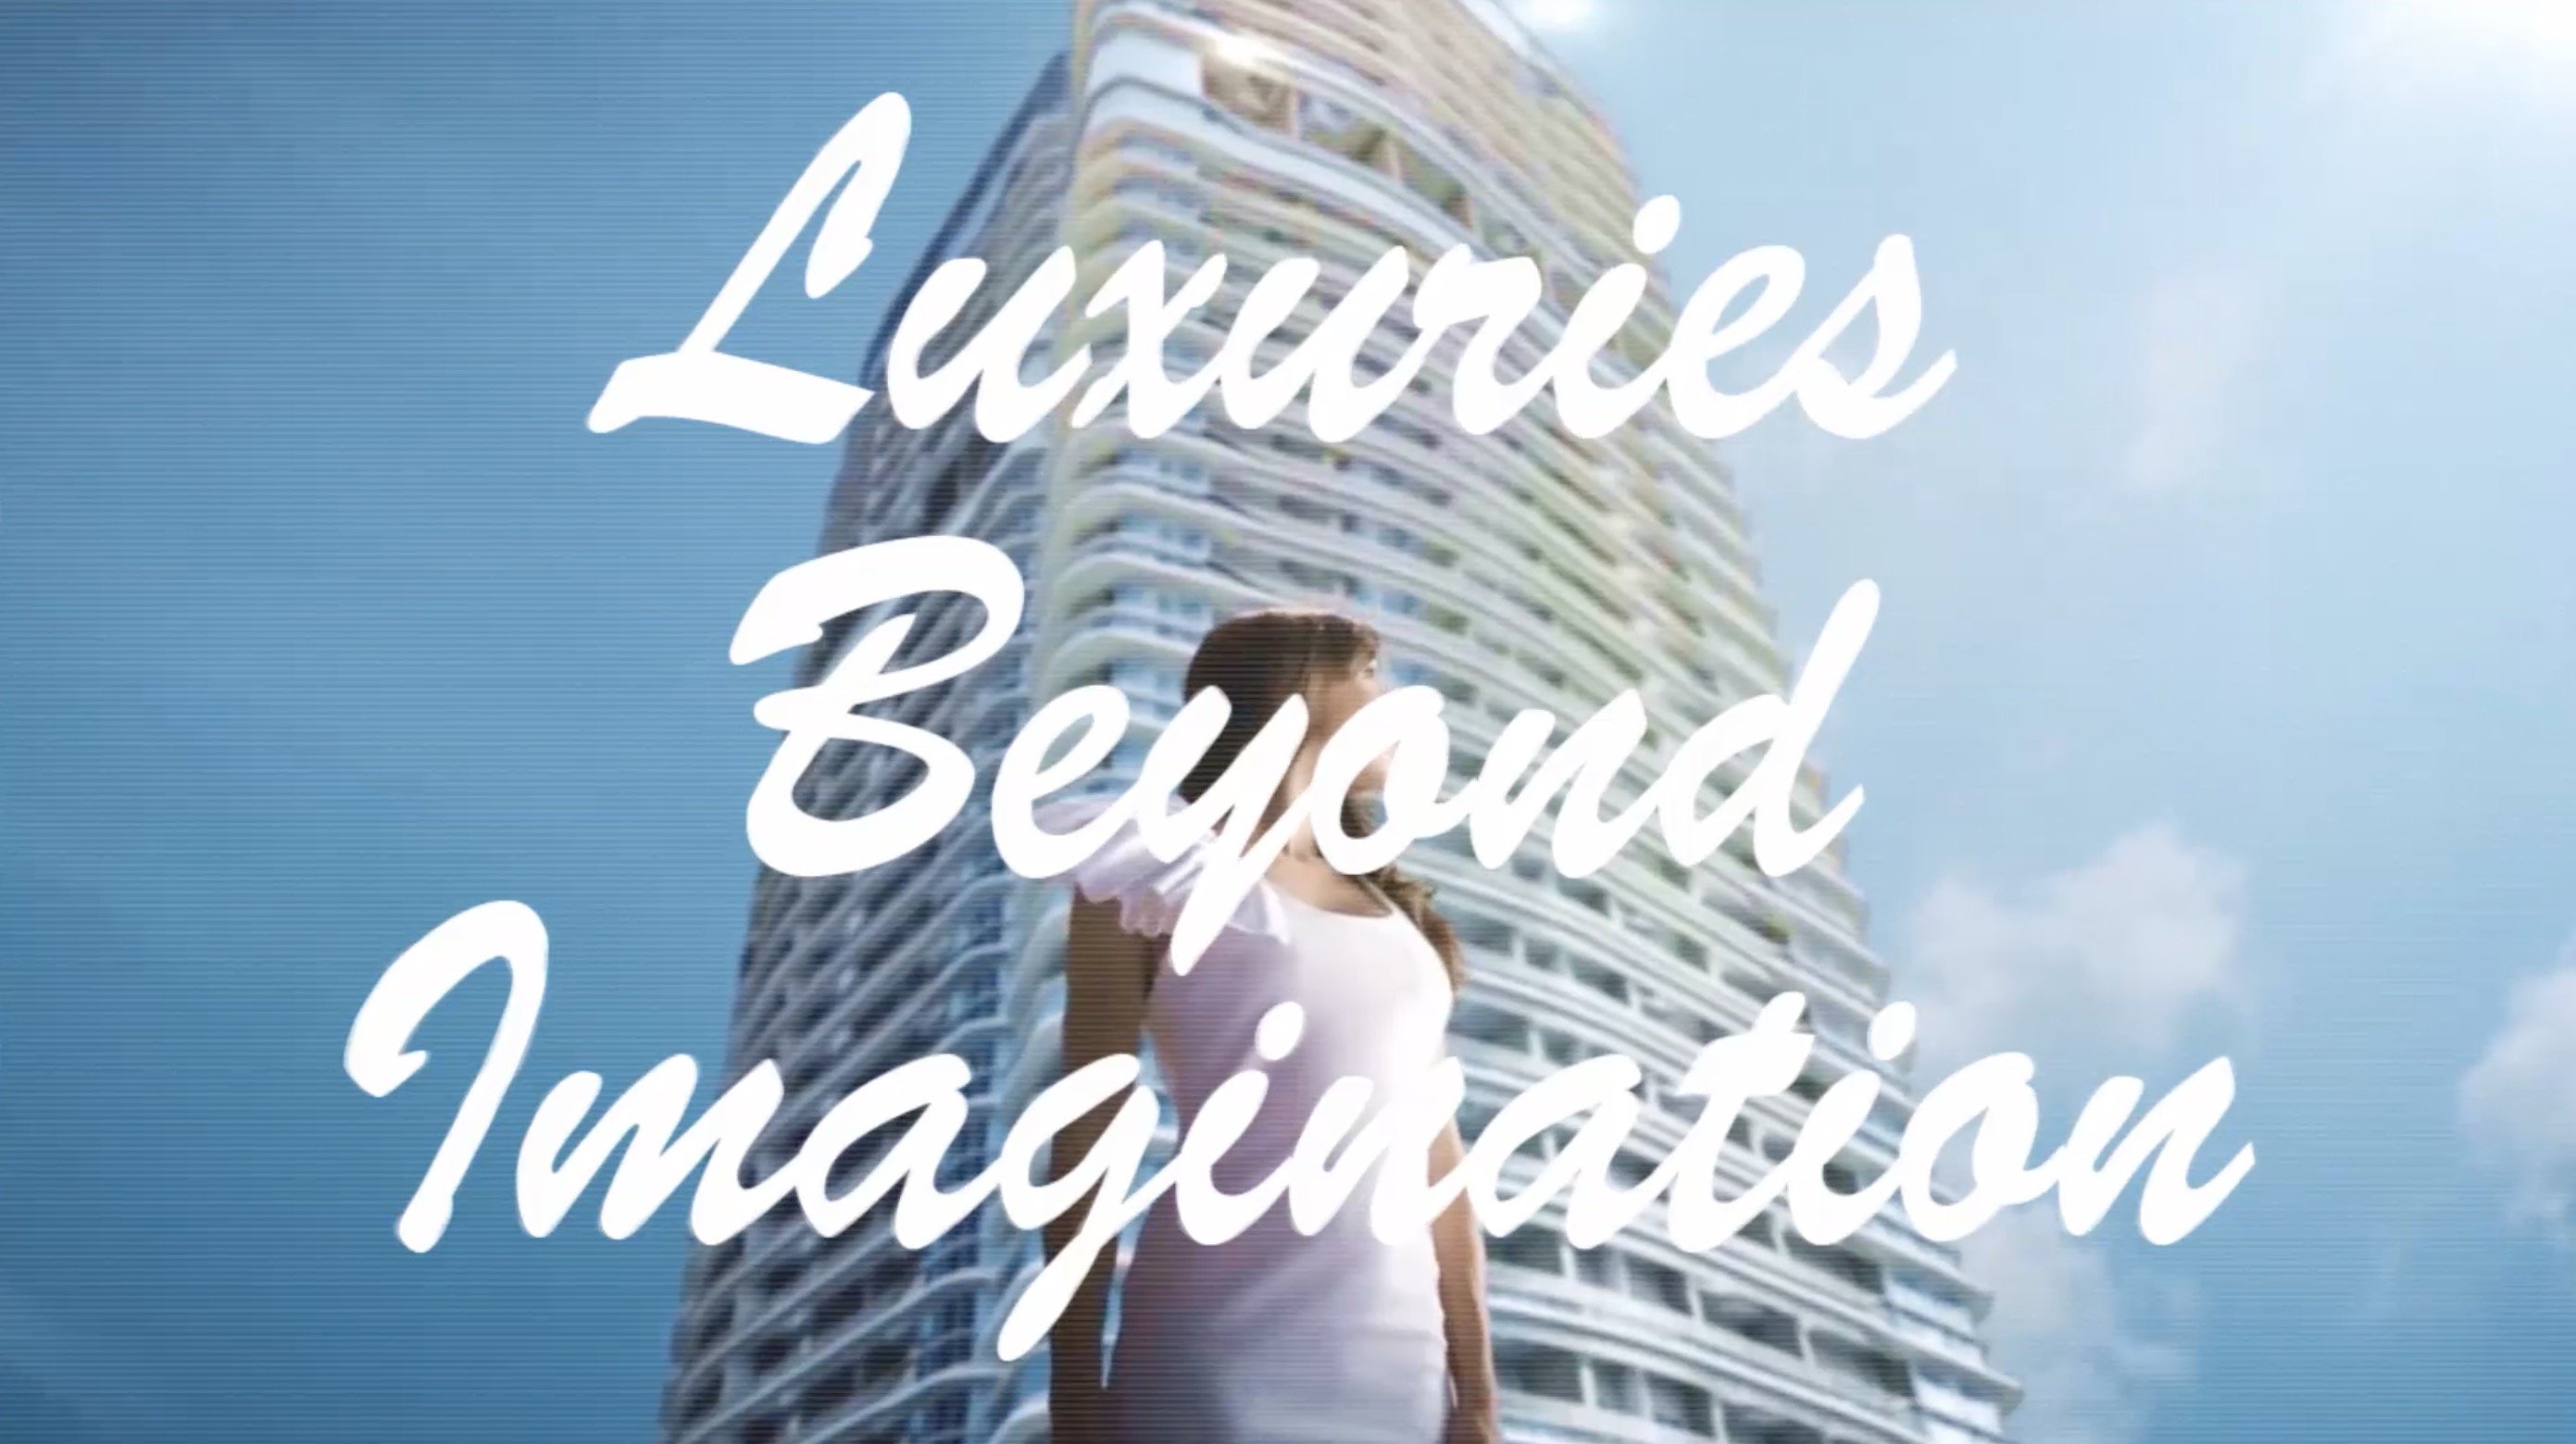
So... we created our own version of this for Casa D'Atas.
There were a lot of trial and error in this process, from selecting music, to the right videos, to the incorporation of type. Then, adding elements like the bird to make the video a little sillier.
4. Quiz
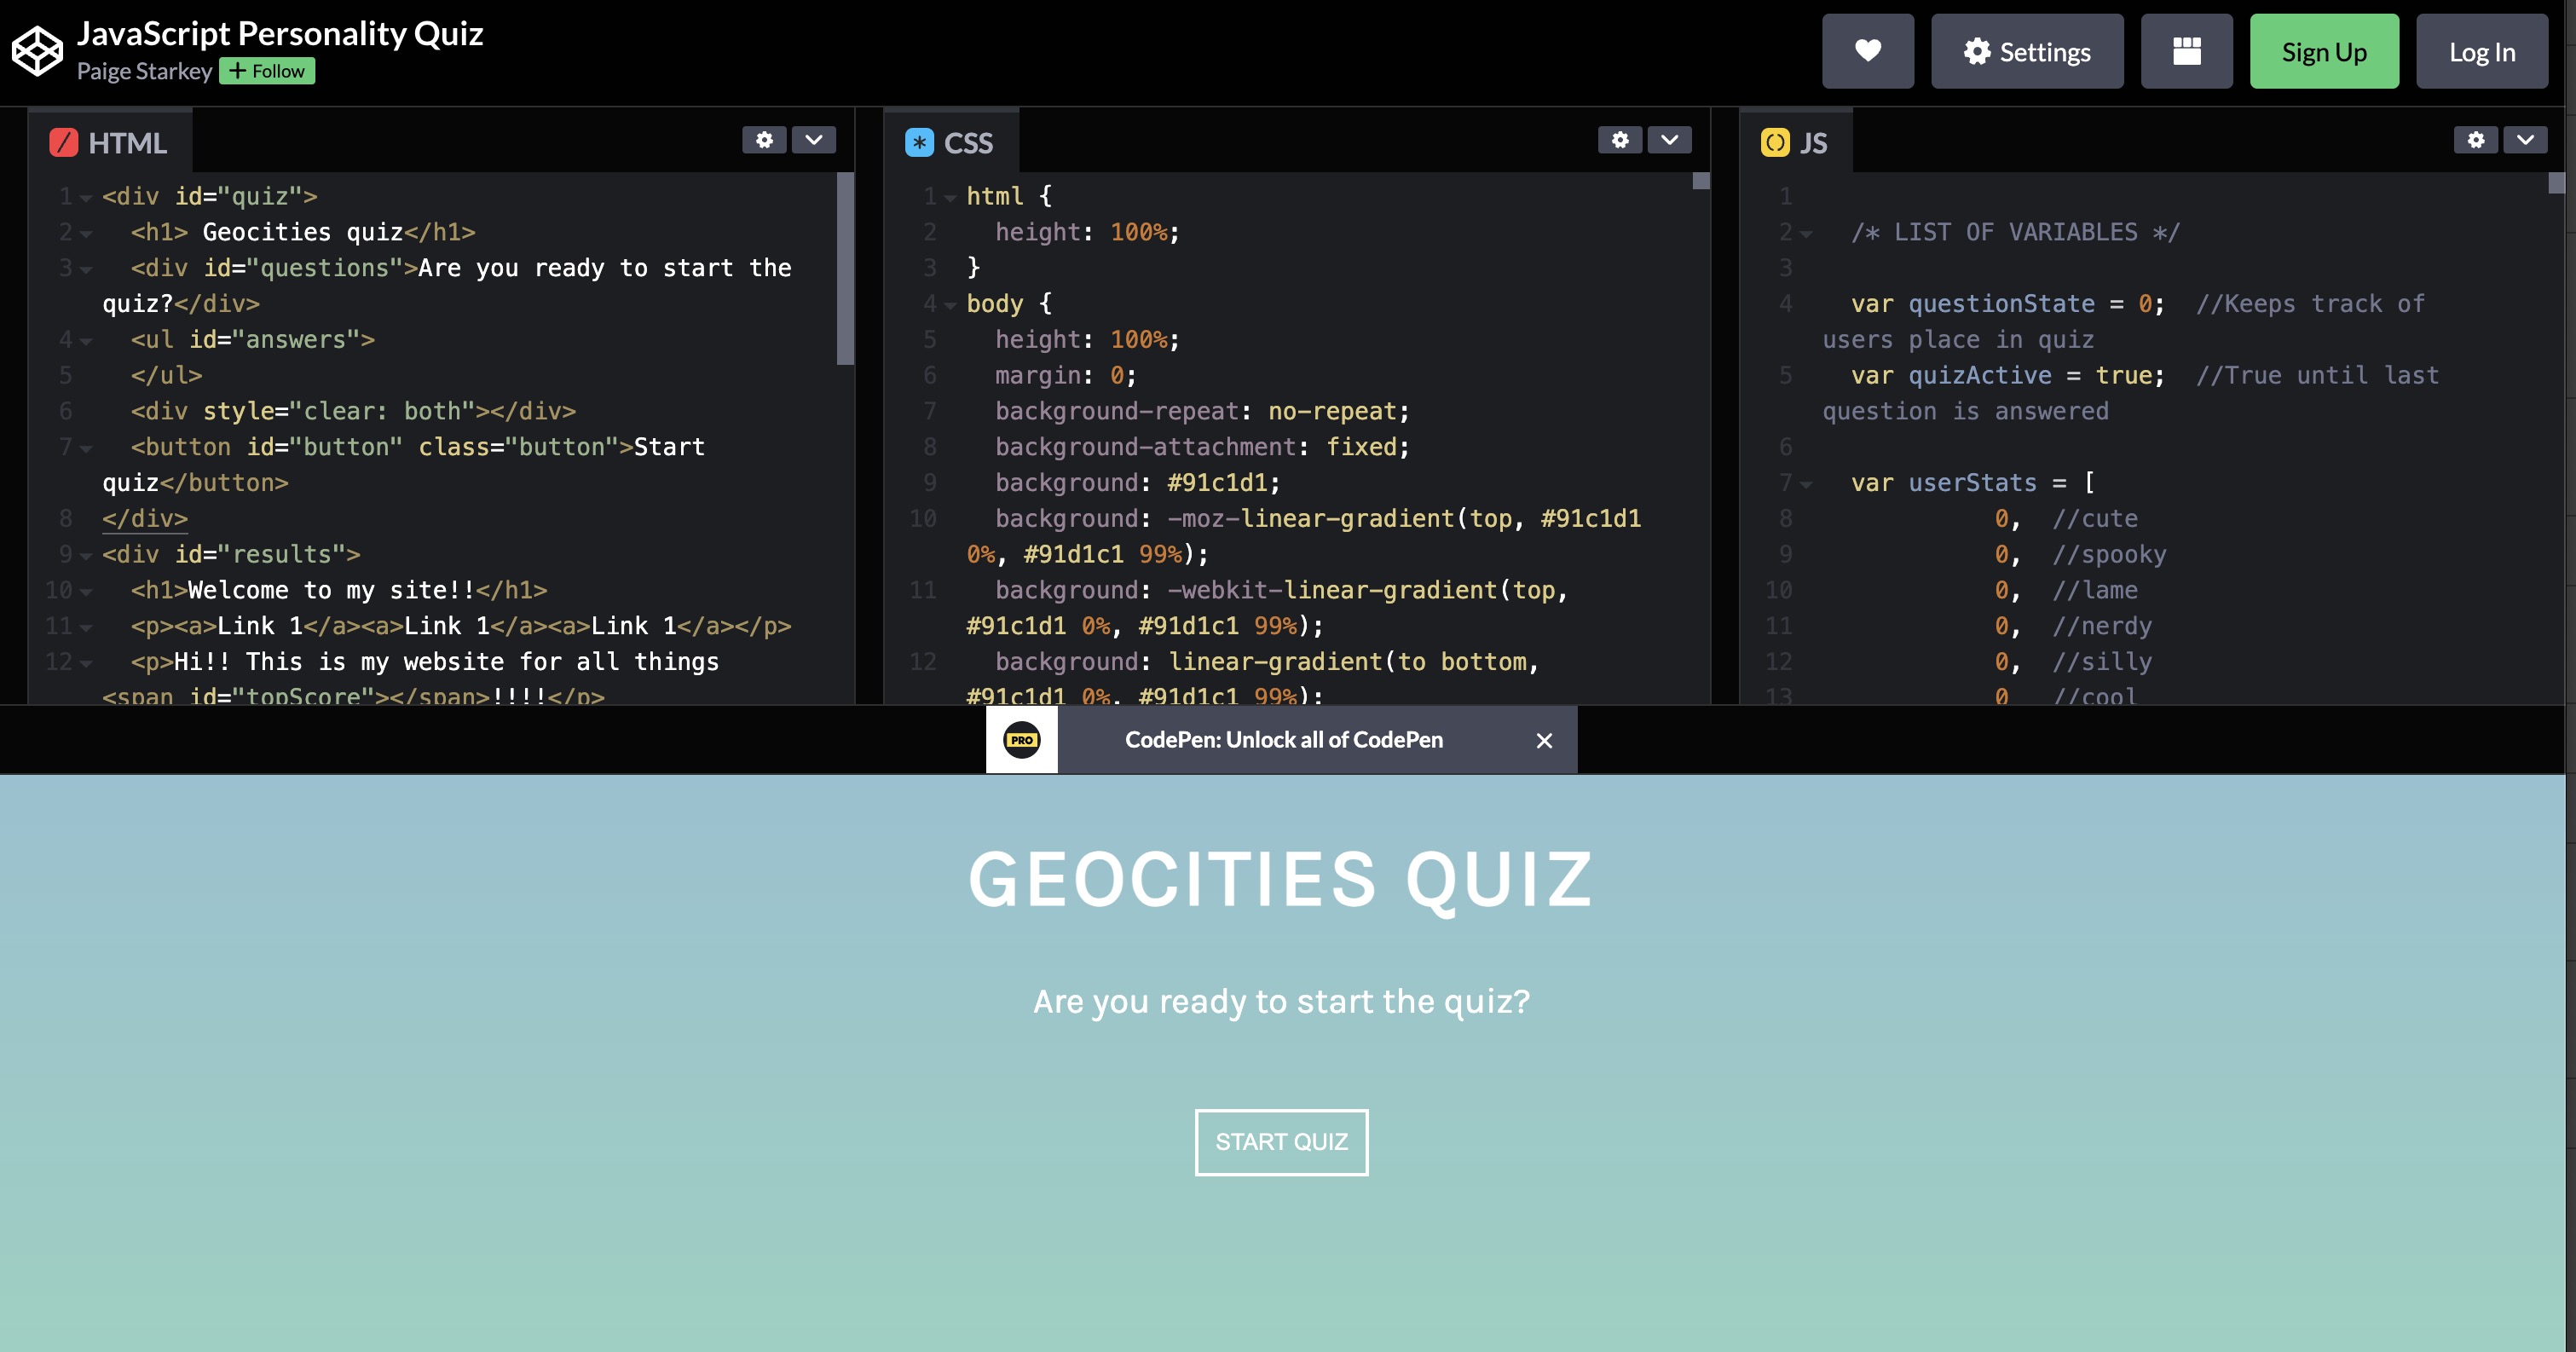
The quiz is an interactive element based on the wide range of data that we have collected for the project. The idea behind the quiz is to utilise the data into a more fun and satire approach in addition to showcasing the trends and patterns from the condominiums.
By taking the quiz, the participants will be asked several questions leading up to the result for their “Perfect Condo” where every option and results of the quiz are a result from the analysed data.
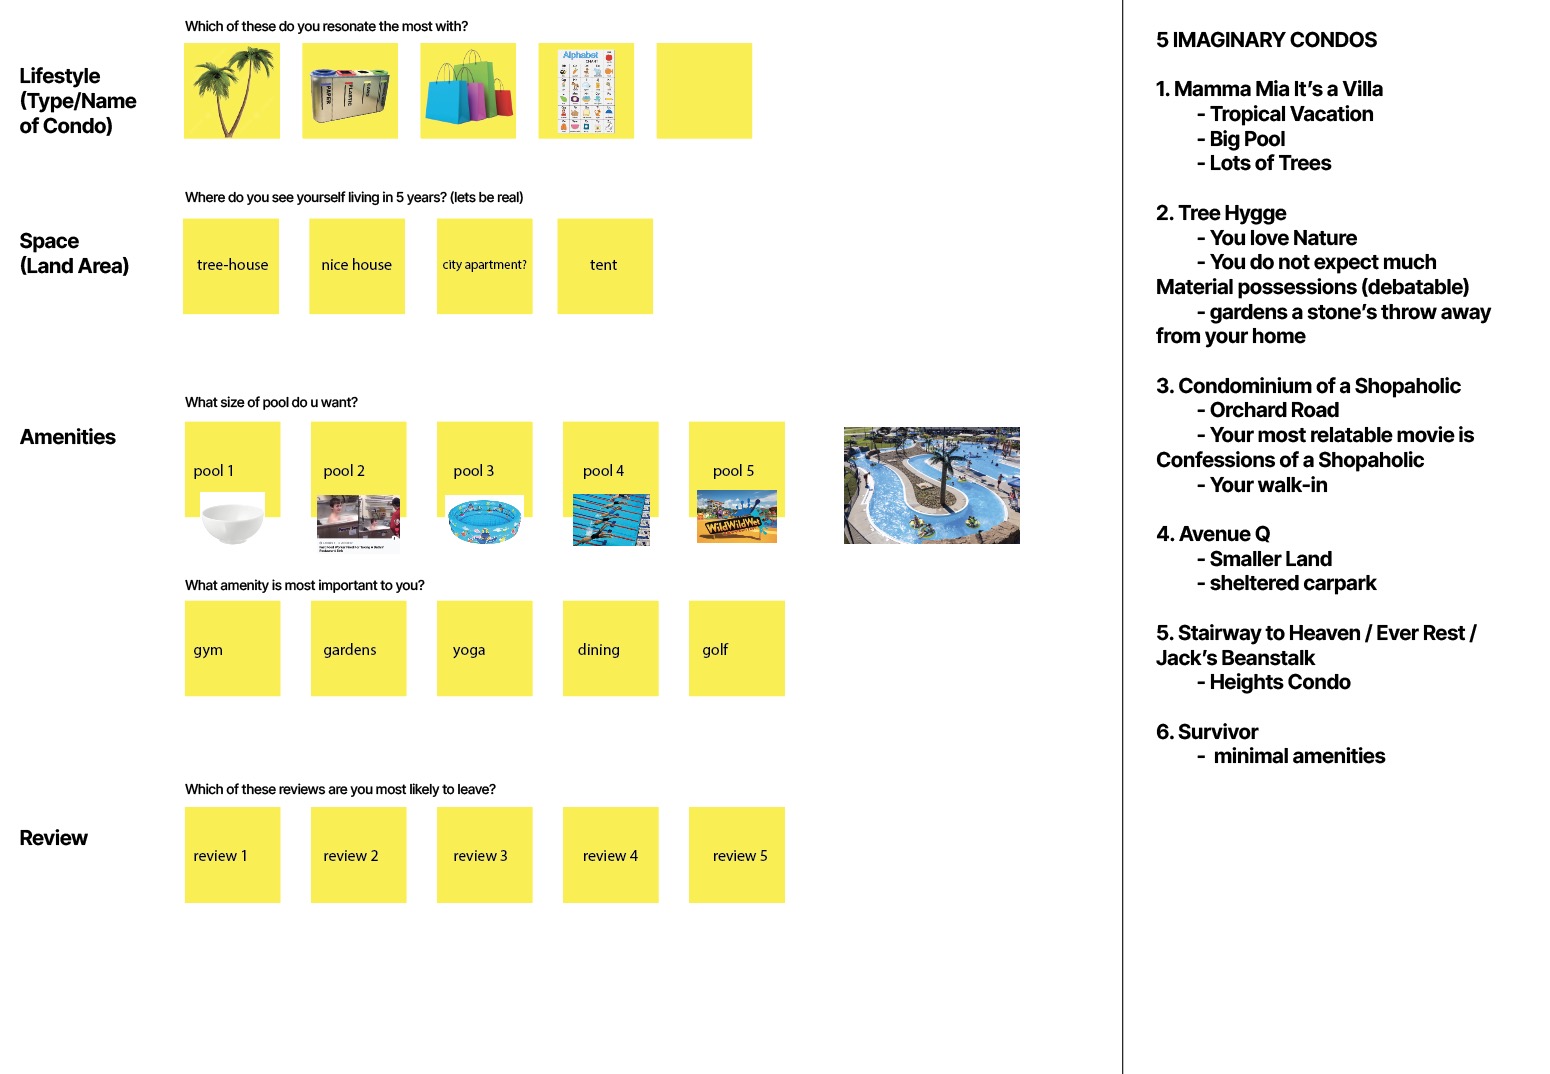
The data-driven personality quiz references directly from the trends and patterns we analysed from the datasets. The primary data that are used in the personality quiz is the condo categories. The dataset compiles 5 different main categories such as:
- Foreign Vacation (Casabella & Villa de West)
- Location/Name (26 Newton & Cairnhill Crest)
- Environmentalist (Hundred Trees & Botanika)
- Heights (Hilltops Luxury & Le Hill)
- Alphabet (D’sunrise & D’zire)
Aside from the main categories, we also included some datasets which are calculated based on the categorizations including: average pool sizes, aesthetic approaches, and reviews.

Quiz Structure, Choices, and Results
Then, we tried and tested a few different codes and templates that would allow us to bring the quiz to life.
We then created 6 different brochures that matched the respective condos.

Video Presentation
In our final presentation, Jo and Gideon suggested documenting our presentation in a video, as the comedic delivery was crucial to the artefact. So, we decided to record ourselves presenting the artefacts as a zoom webinar.
Our approach to the presentation here was to act like as if this was a real professional webinar. That, in contrast with the absurd visuals and video, helped us to find humour in the uncomfortable atmosphere that zoom webinars usually have.
Click here to attend the full webinar.
Linked in the website as a free webinar
Conclusion
With the data collection, we faced some roadblocks with finding data on condos, especially older ones. However, we just moved on and worked with the data that we were able to find.
We're quite happy with what we were able to achieve overall. However, were we not limited by our knowledge with javascript and time, we would've fleshed out the quiz a little bit more visually.
It would also have been interesting to see how we could've incorporated AI into the video. From that brief test video alone, we got to see how AI responded to the script that we gave. If we had more time, we could explore how AI responds to ideas of luxury and through that, investigate how the internet as a whole documents luxury.
